Insights: The Massachusetts' Educational Landscape
Massachusetts manages one of the largest public education systems in the United States, with over 1,800 schools across 410 districts serving nearly one million students. Understanding how resources, demographics, and outcomes interact across such a large system is essential for data-informed decisions.
This project uses school- and district-level data from the Massachusetts Department of Education to explore how socioeconomic factors, student composition, and academic outcomes relate to one another. The dashboard below is designed for educators, policymakers, and community members who want to quickly understand patterns in graduation, dropout, college attendance, and test performance across the state.
Using Tableau, I transformed this complex dataset into intuitive visualizations that surface key trends and correlations without requiring technical expertise. The goal is not only to highlight inequities and outliers, but also to support more grounded conversations about where to focus attention and how different communities experience the education system.
Some Key Takeaways
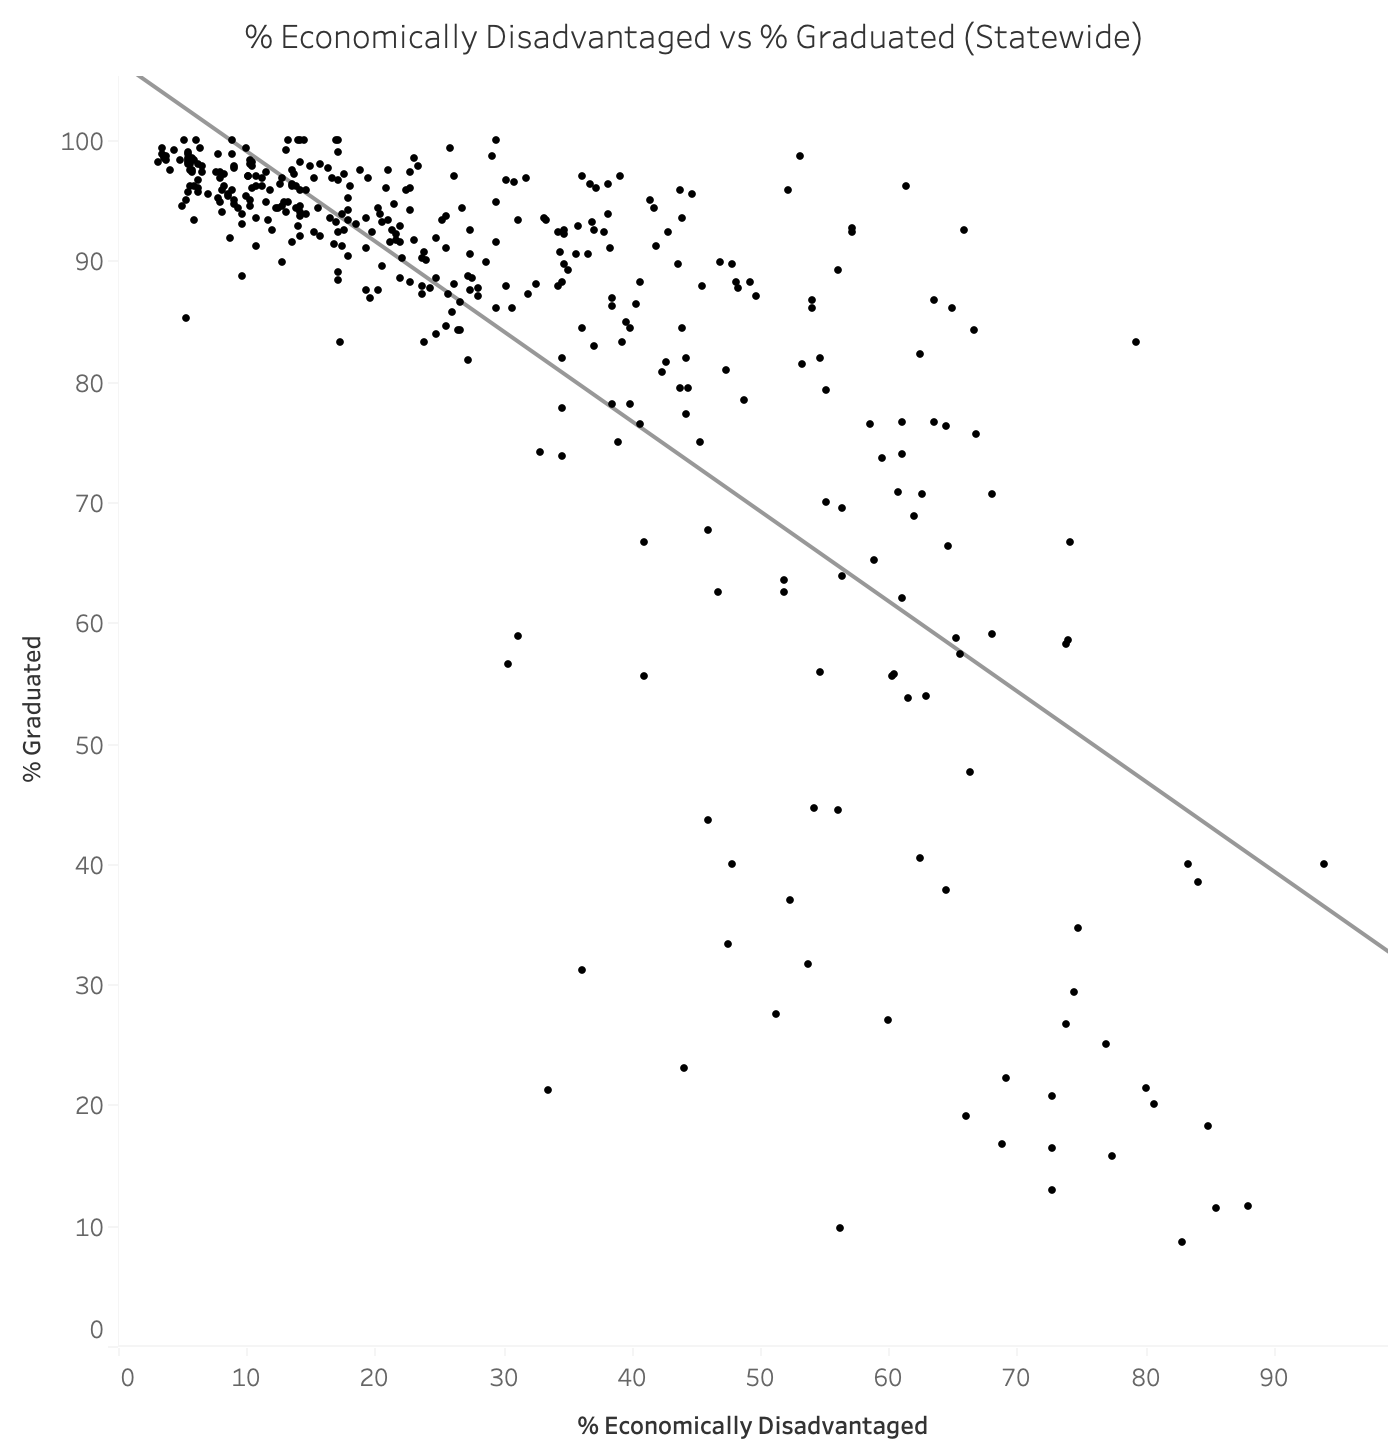
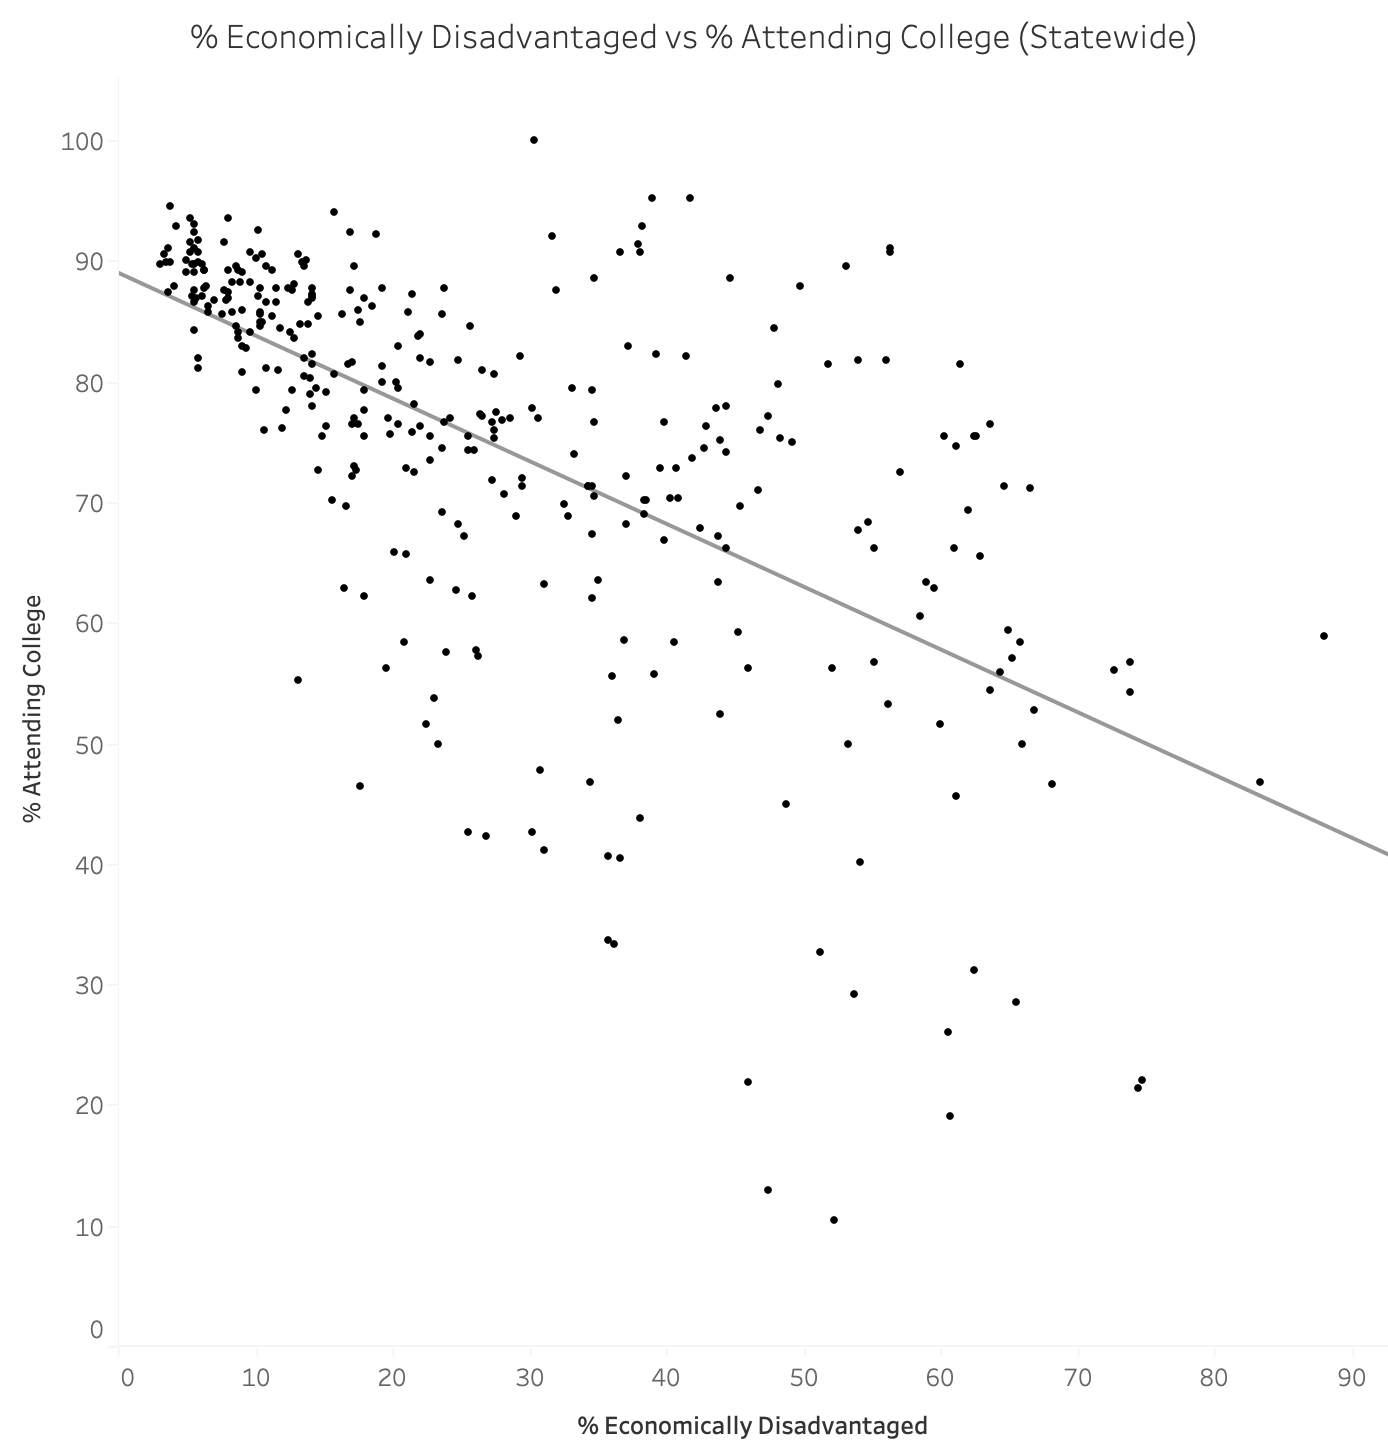
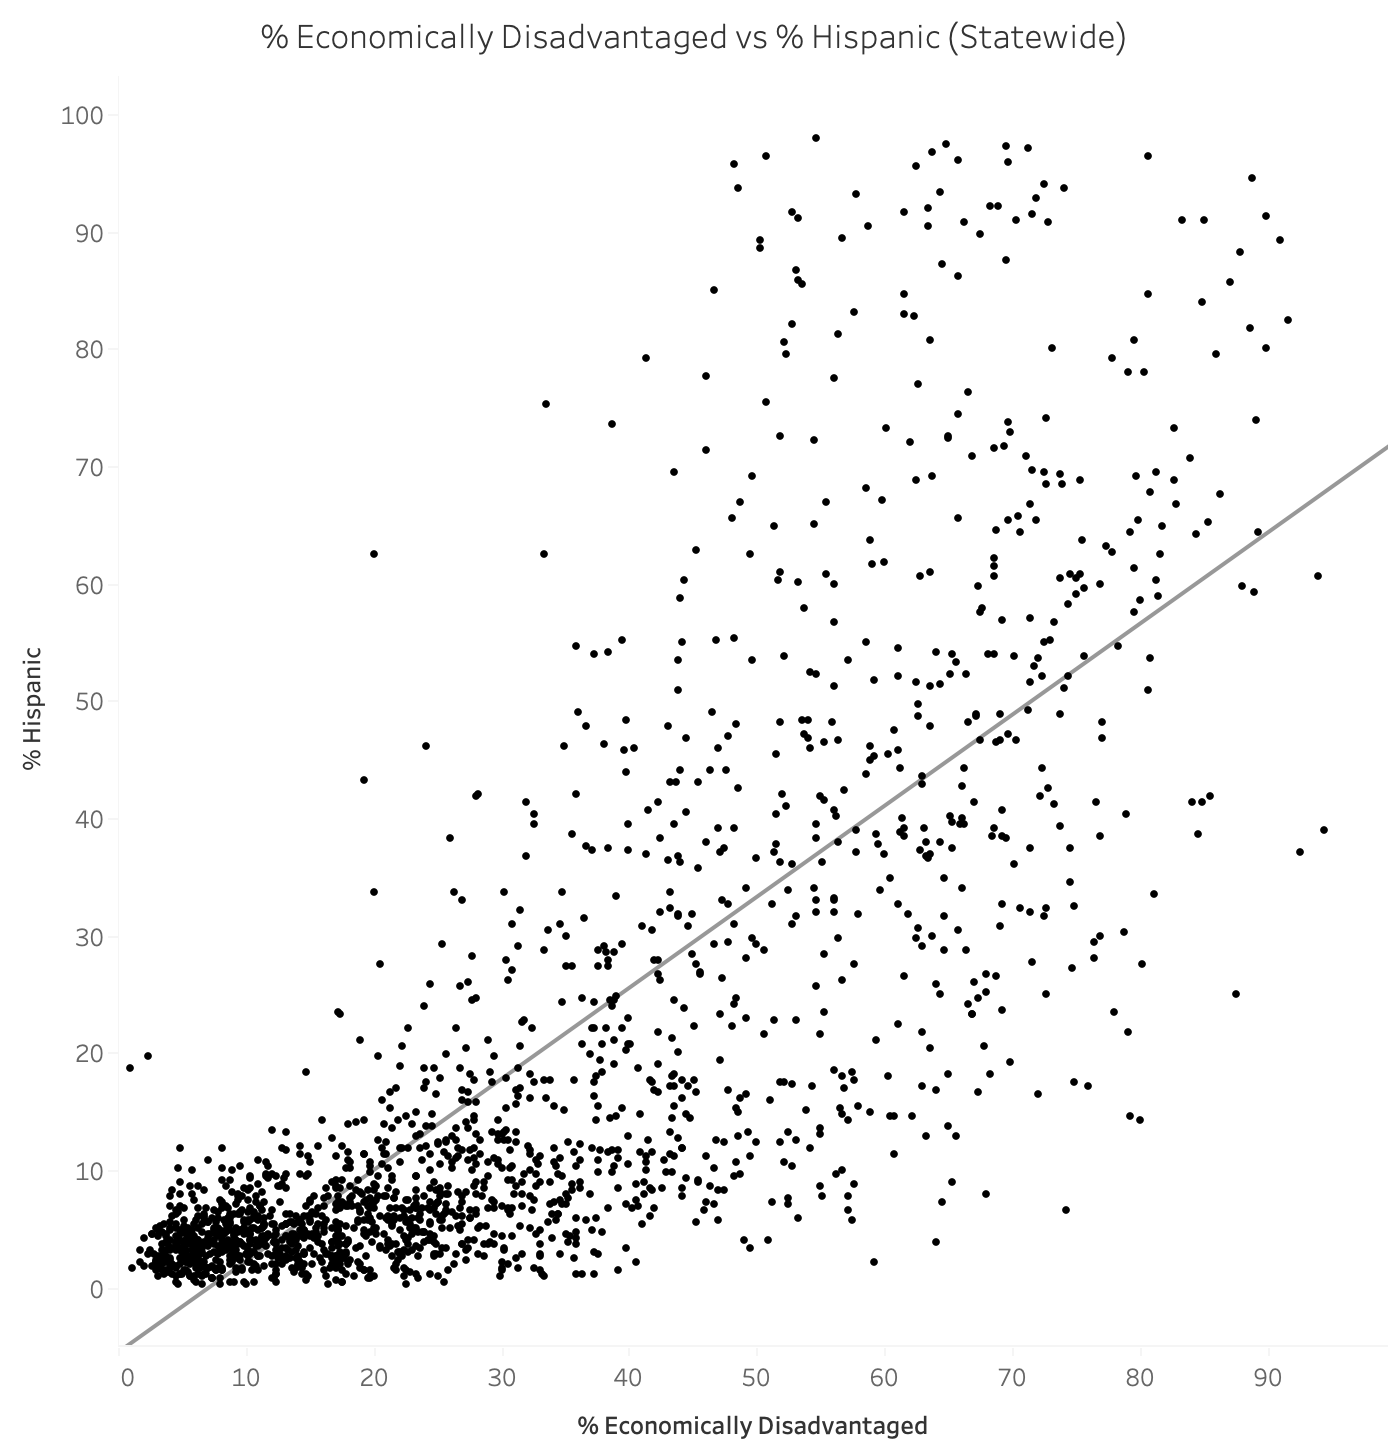
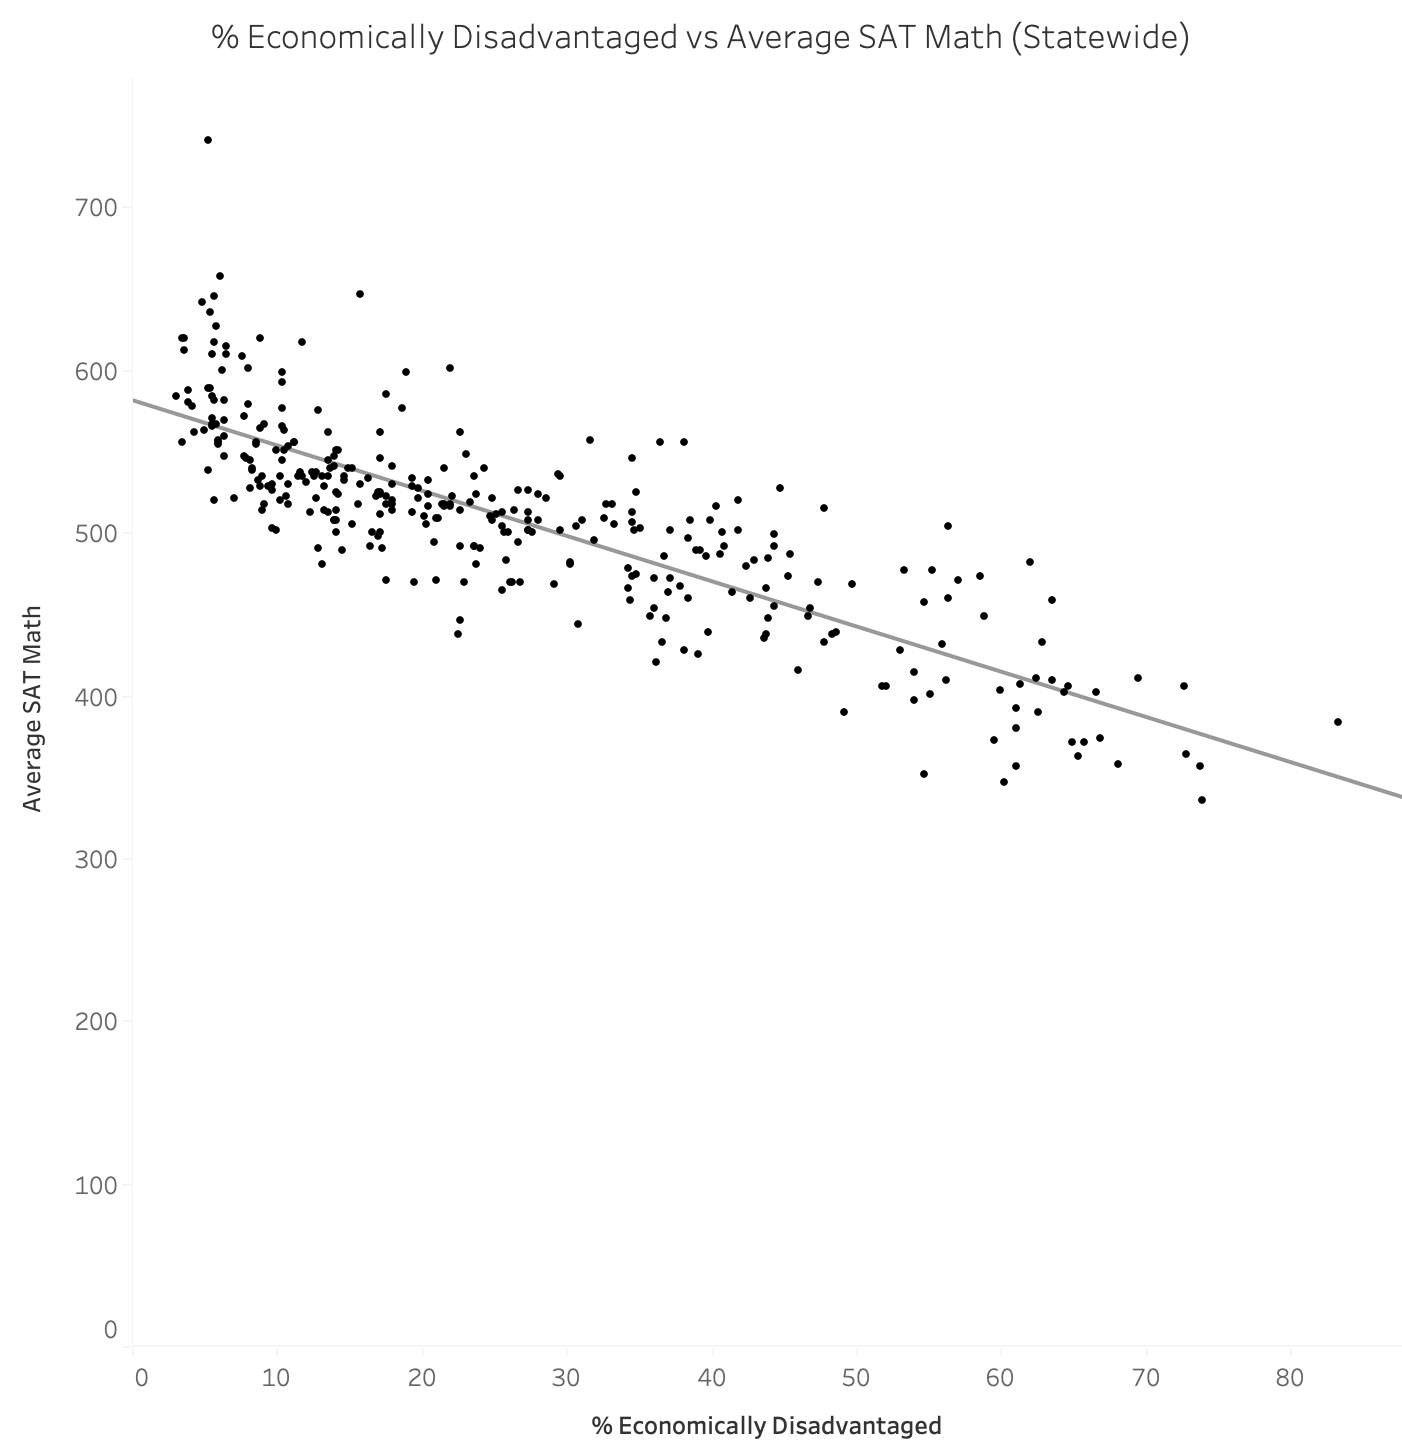
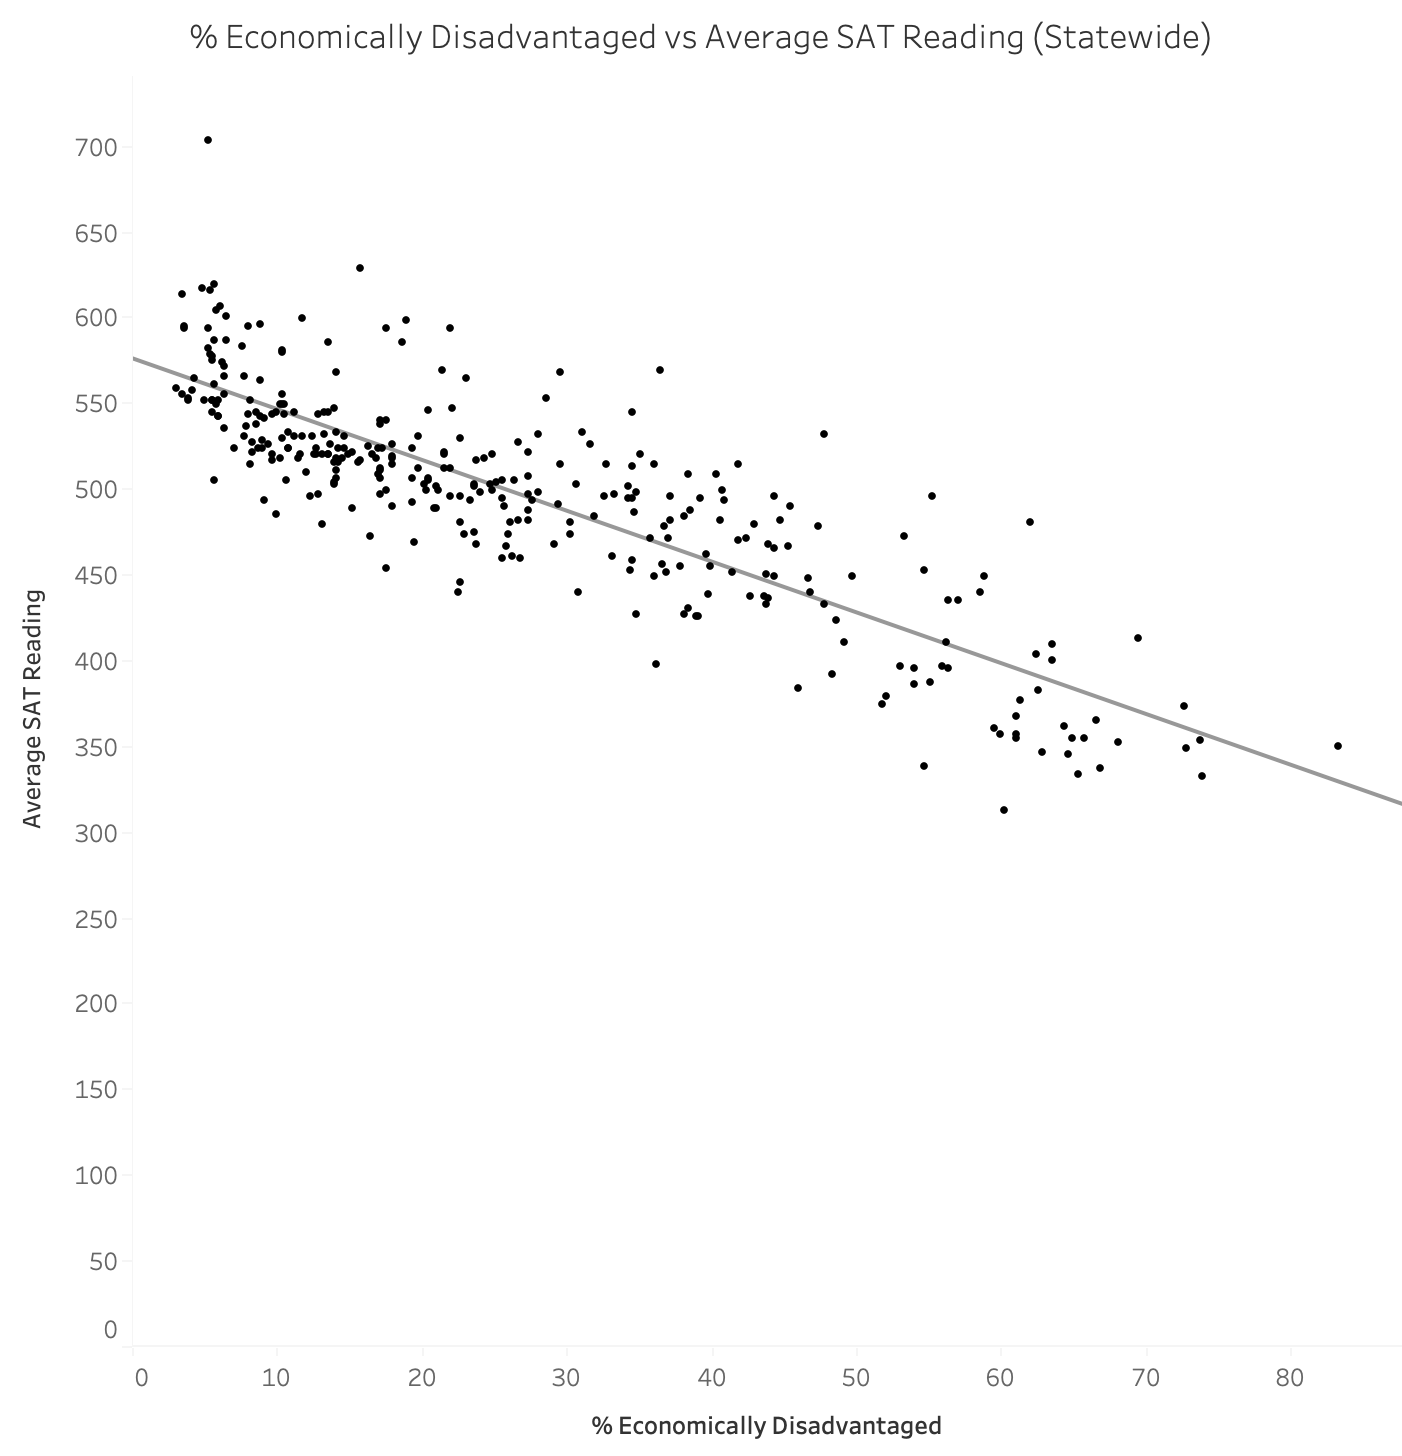
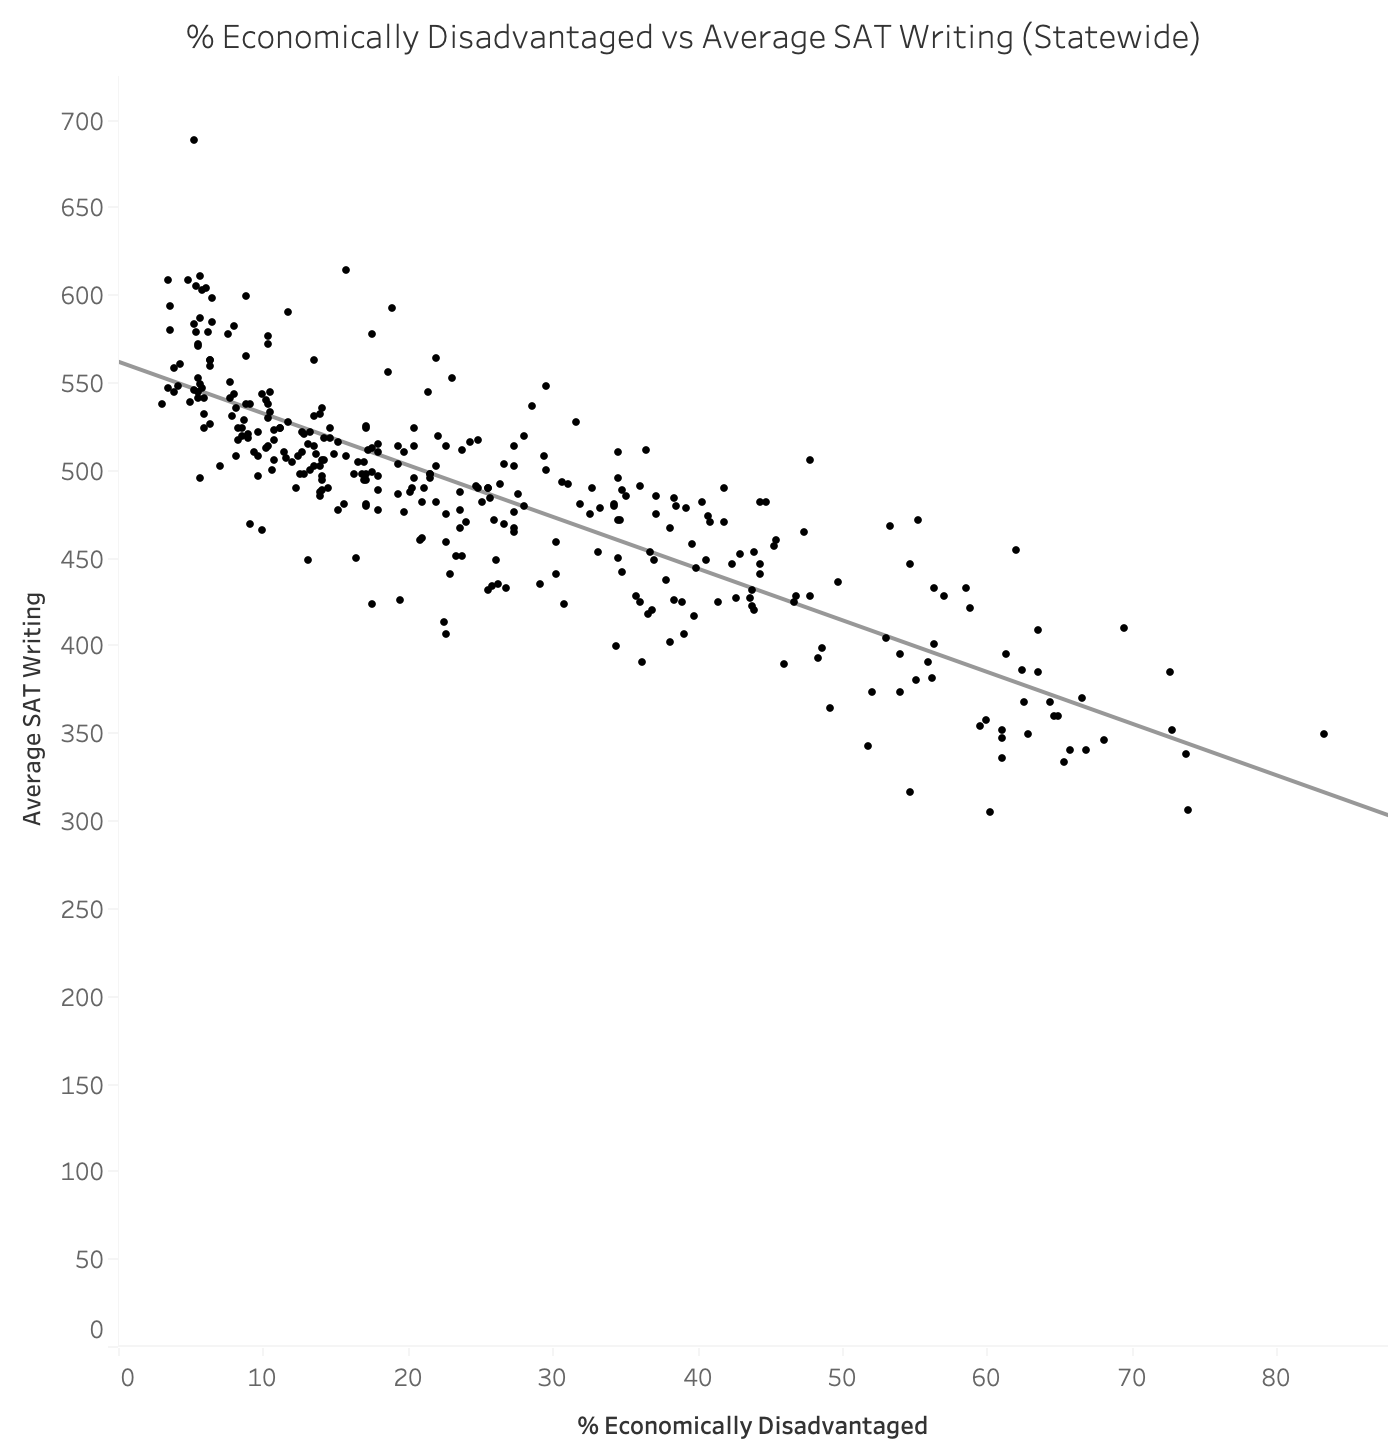
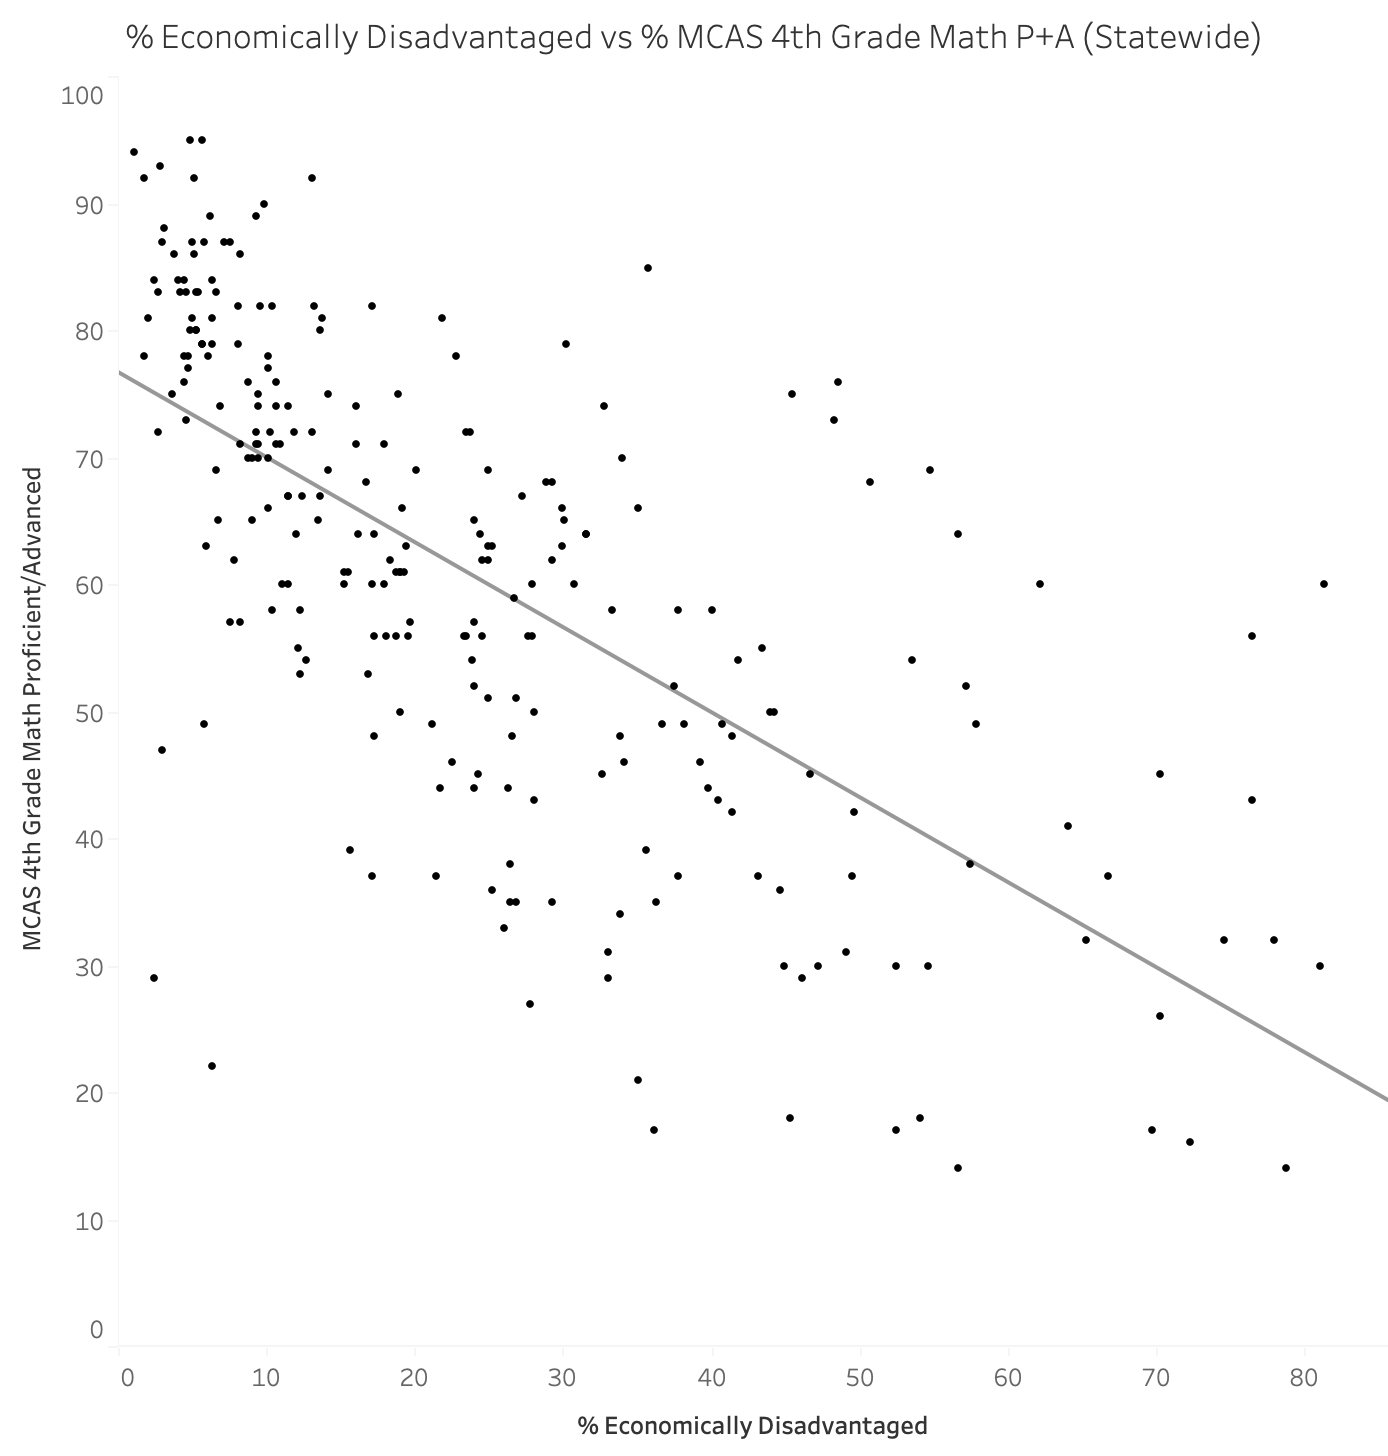
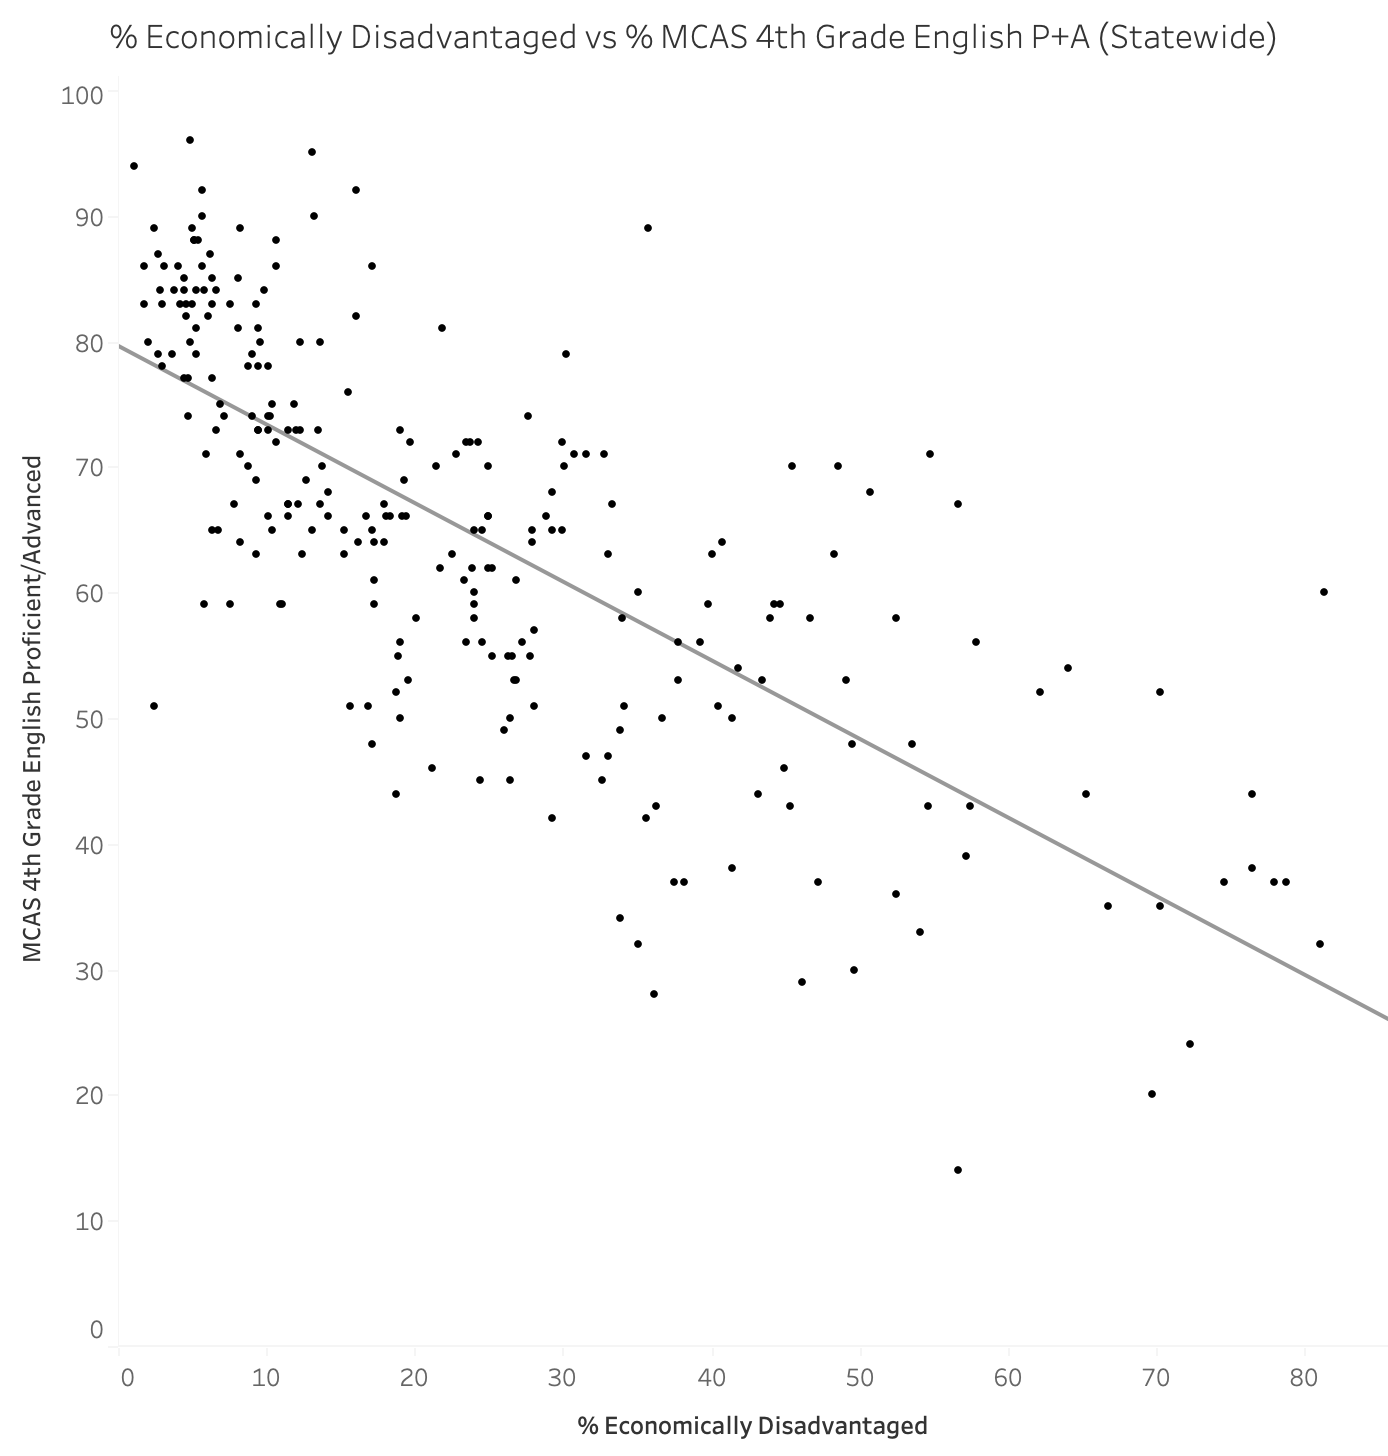
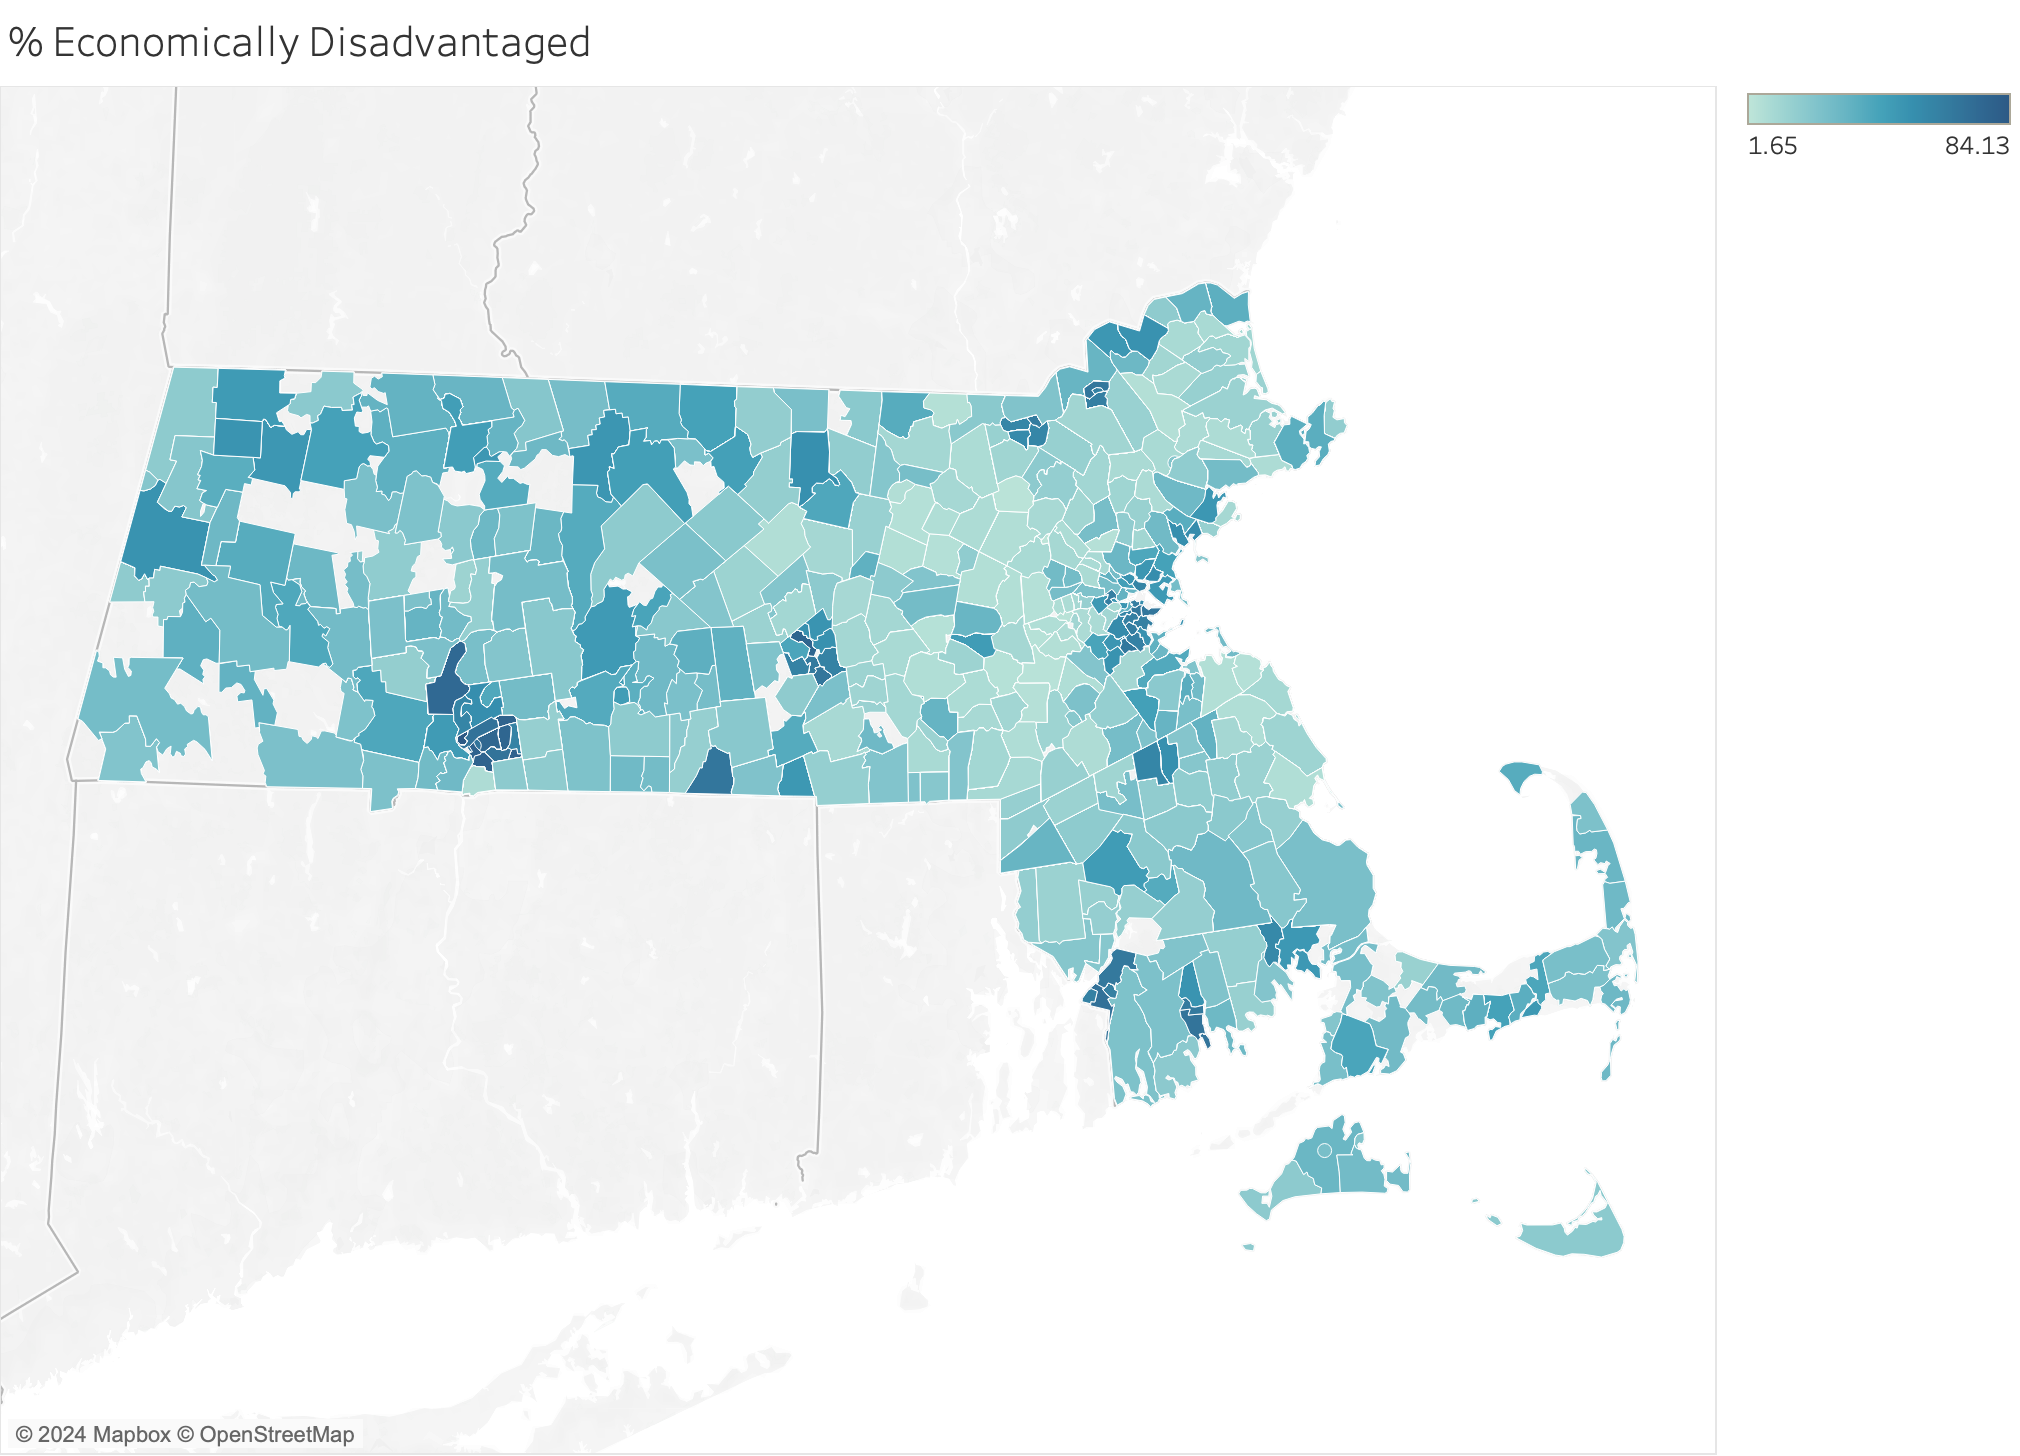
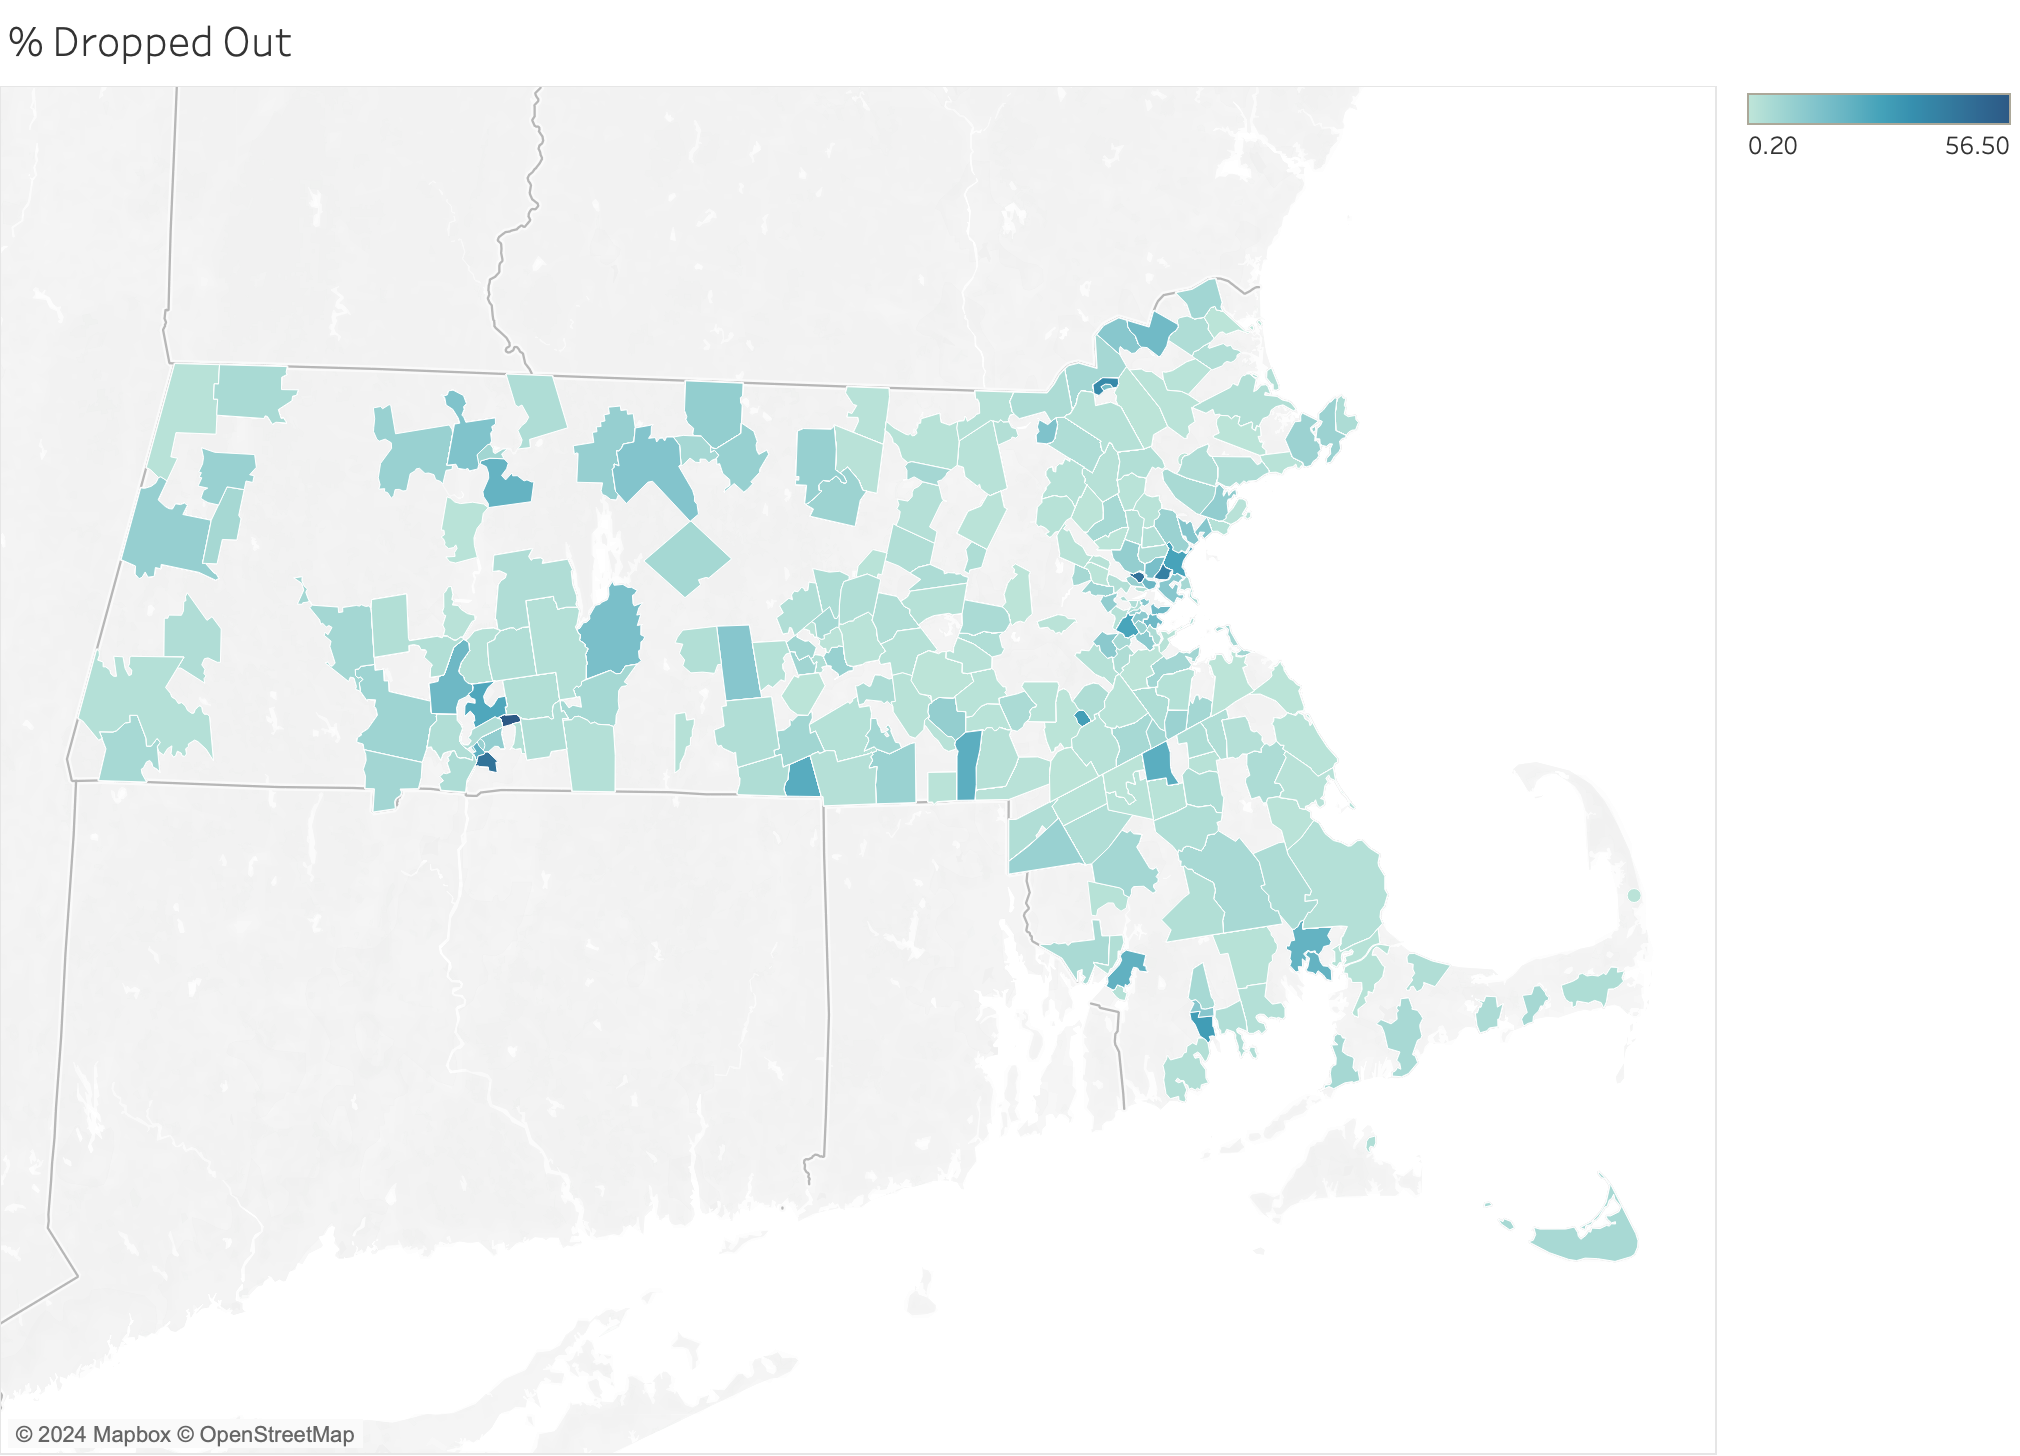
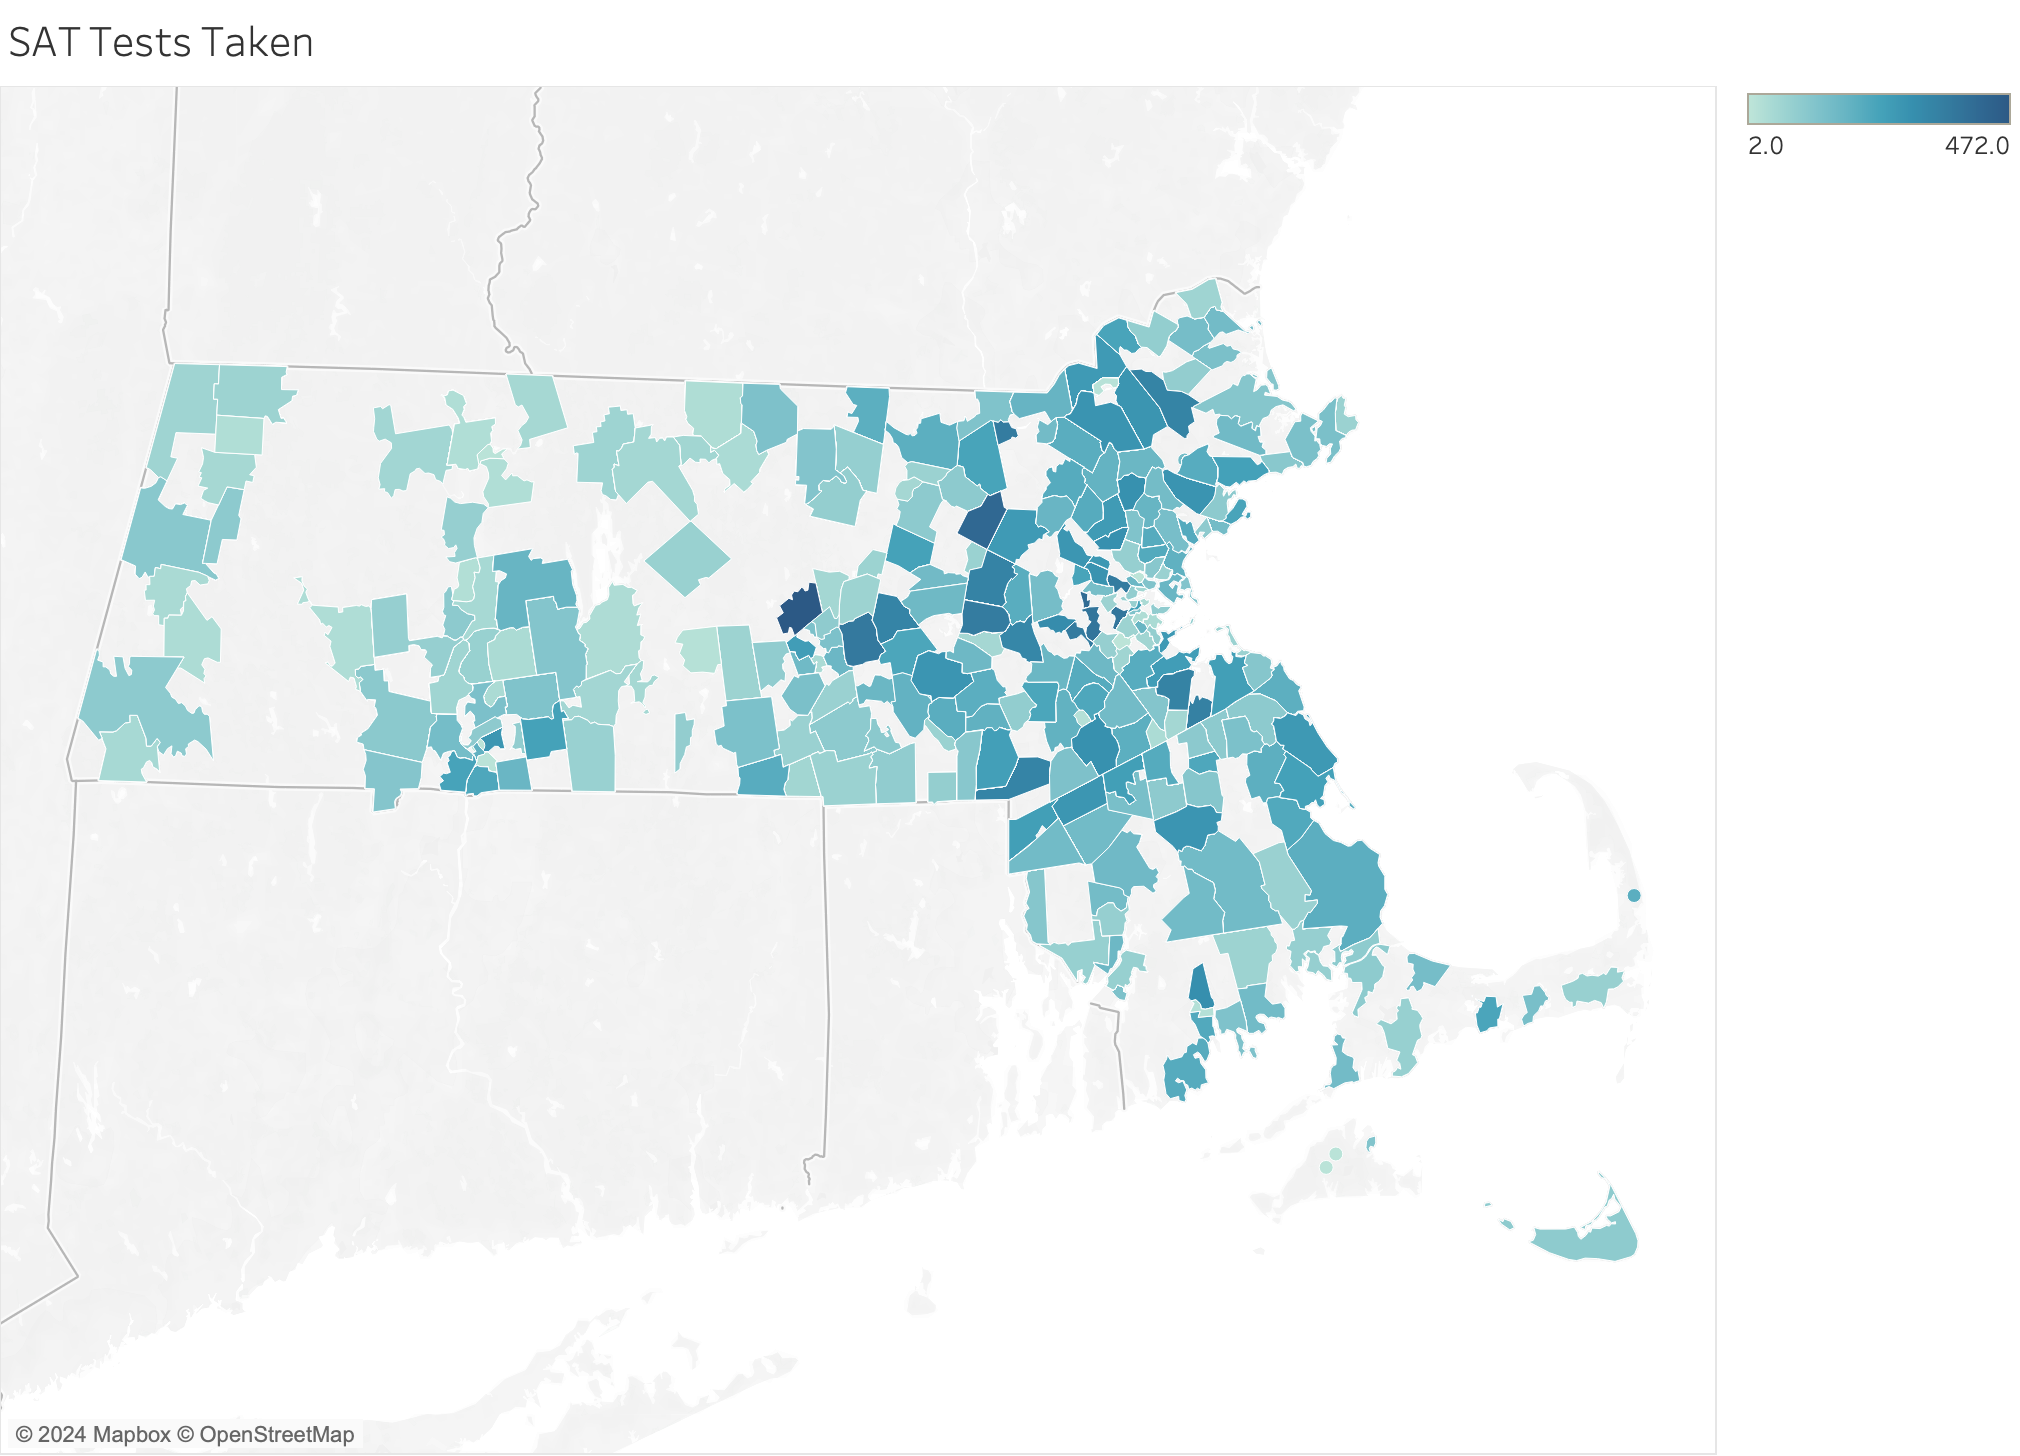
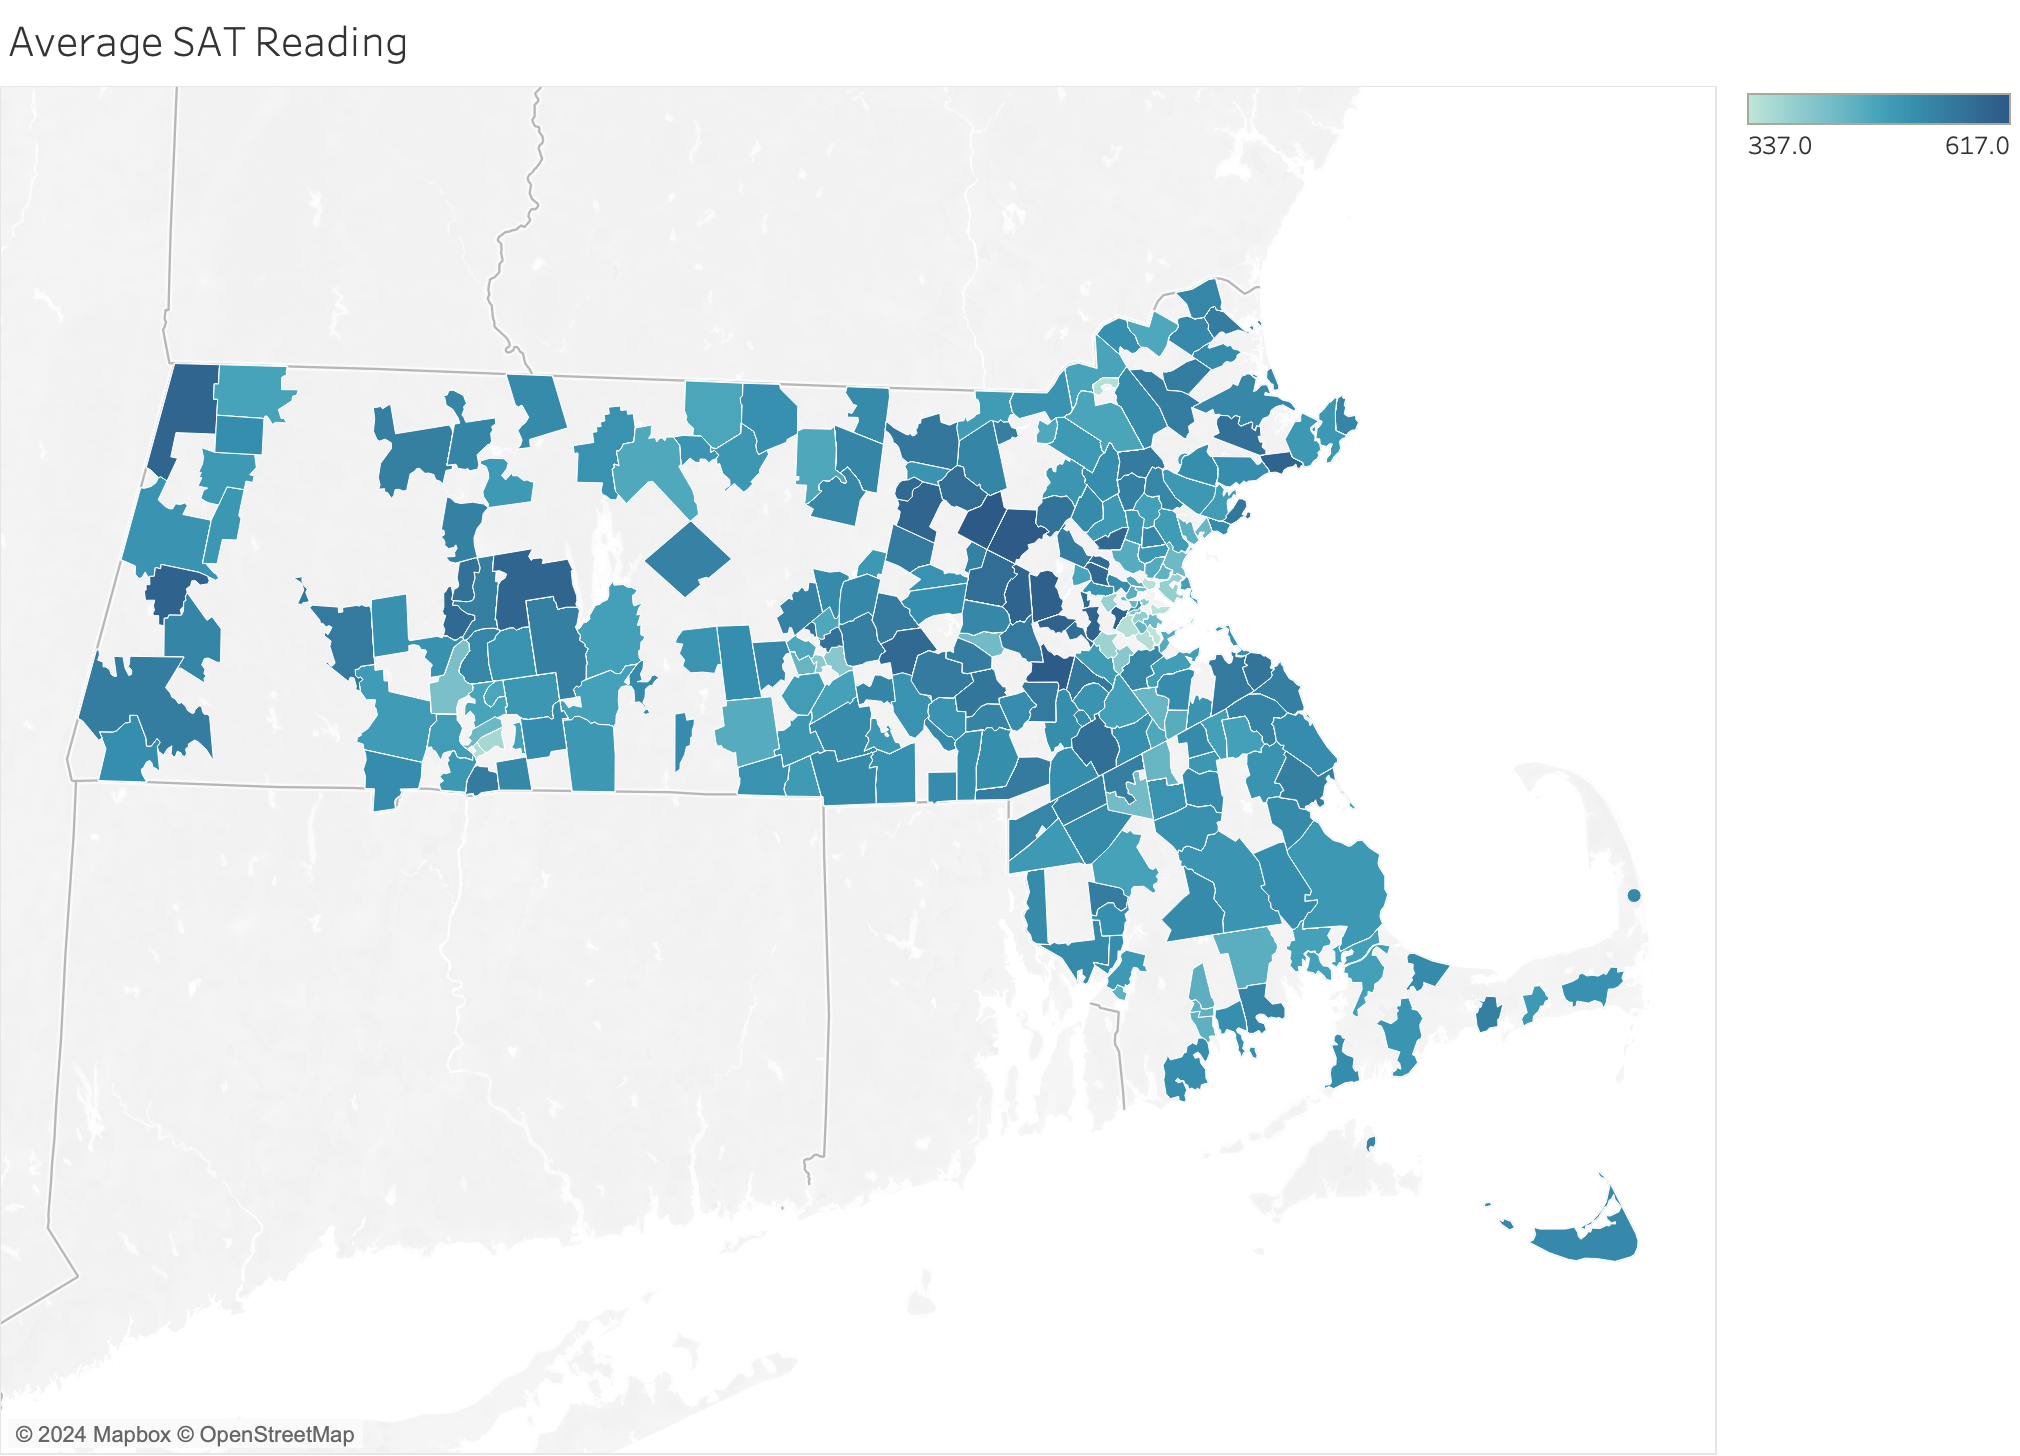
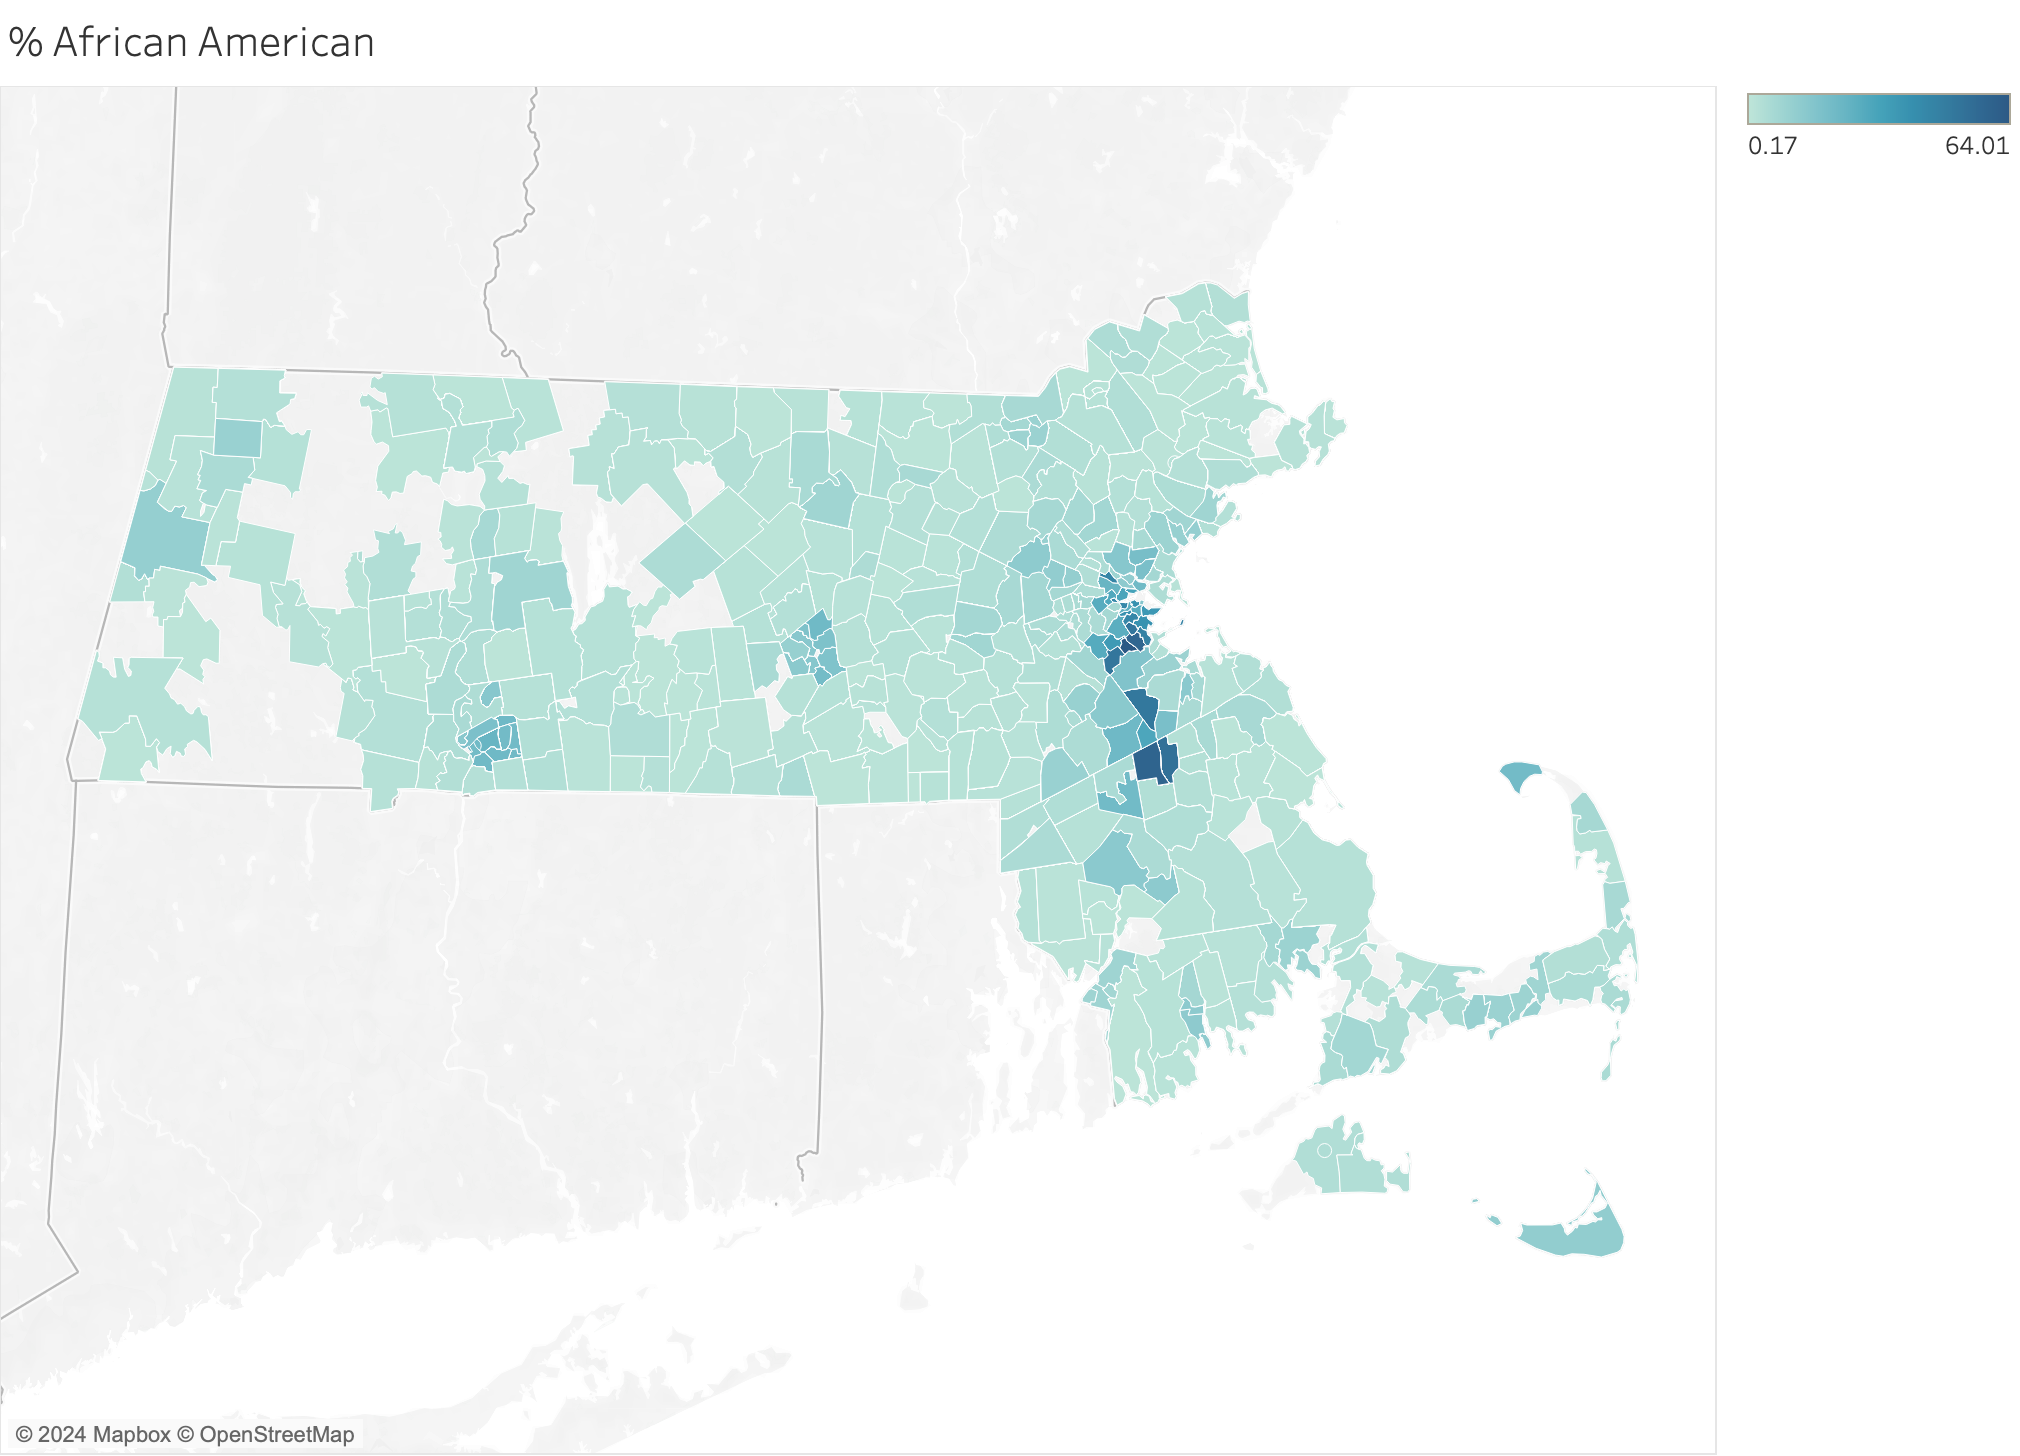
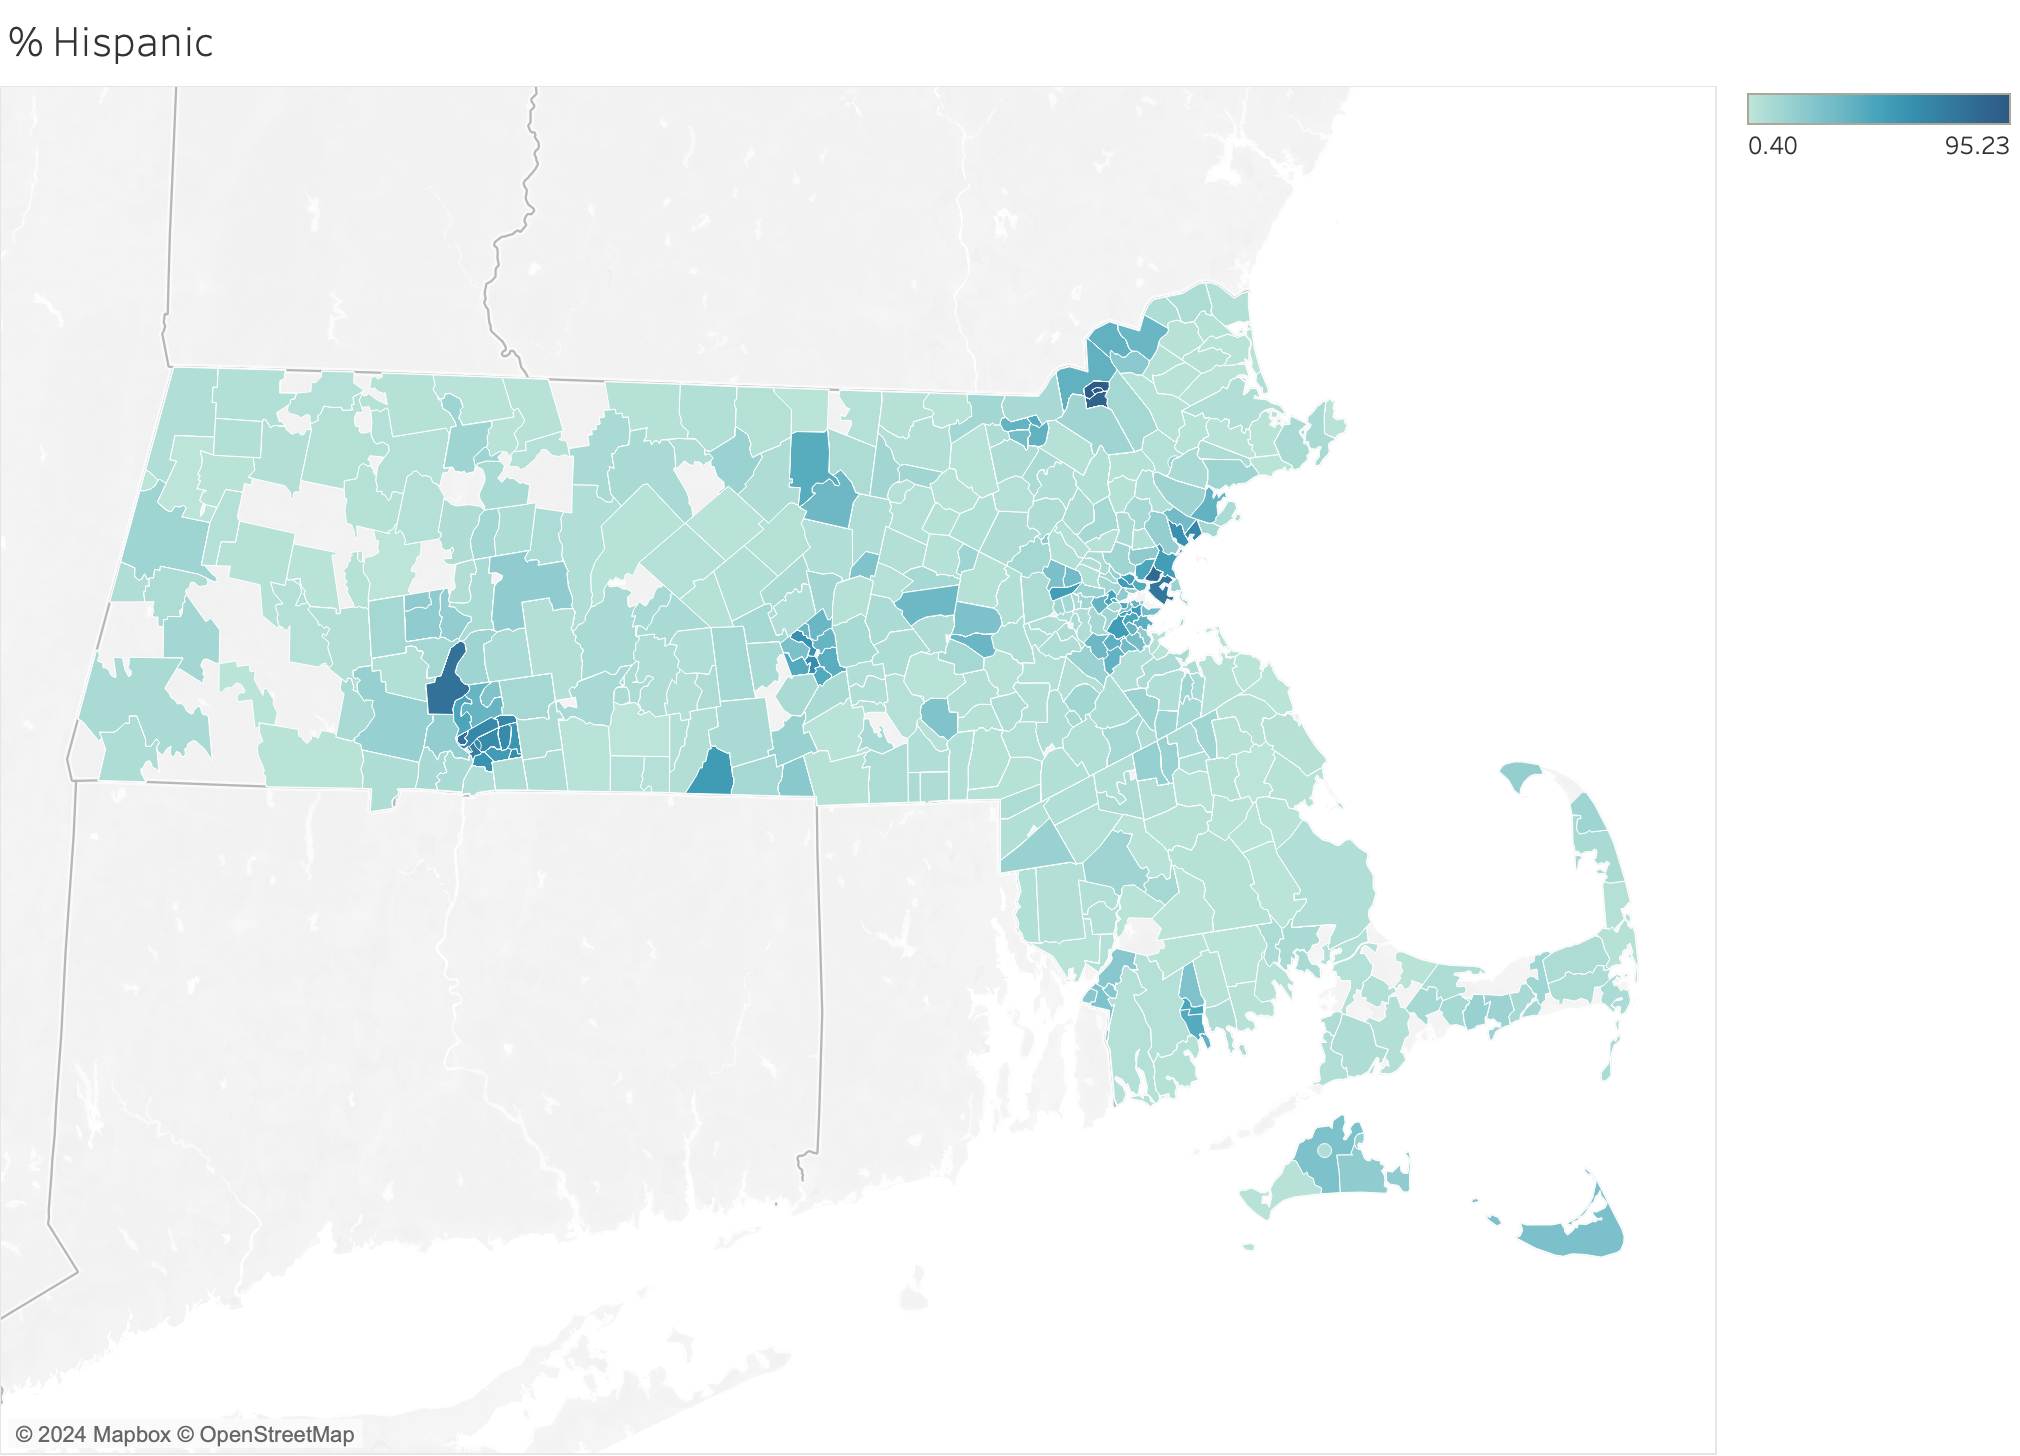
- Schools with higher percentages of high-needs and economically disadvantaged students tend to show weaker academic outcomes across multiple measures (graduation, college attendance, SAT, and MCAS performance). These schools also enroll a higher proportion of Hispanic students compared to the statewide average.
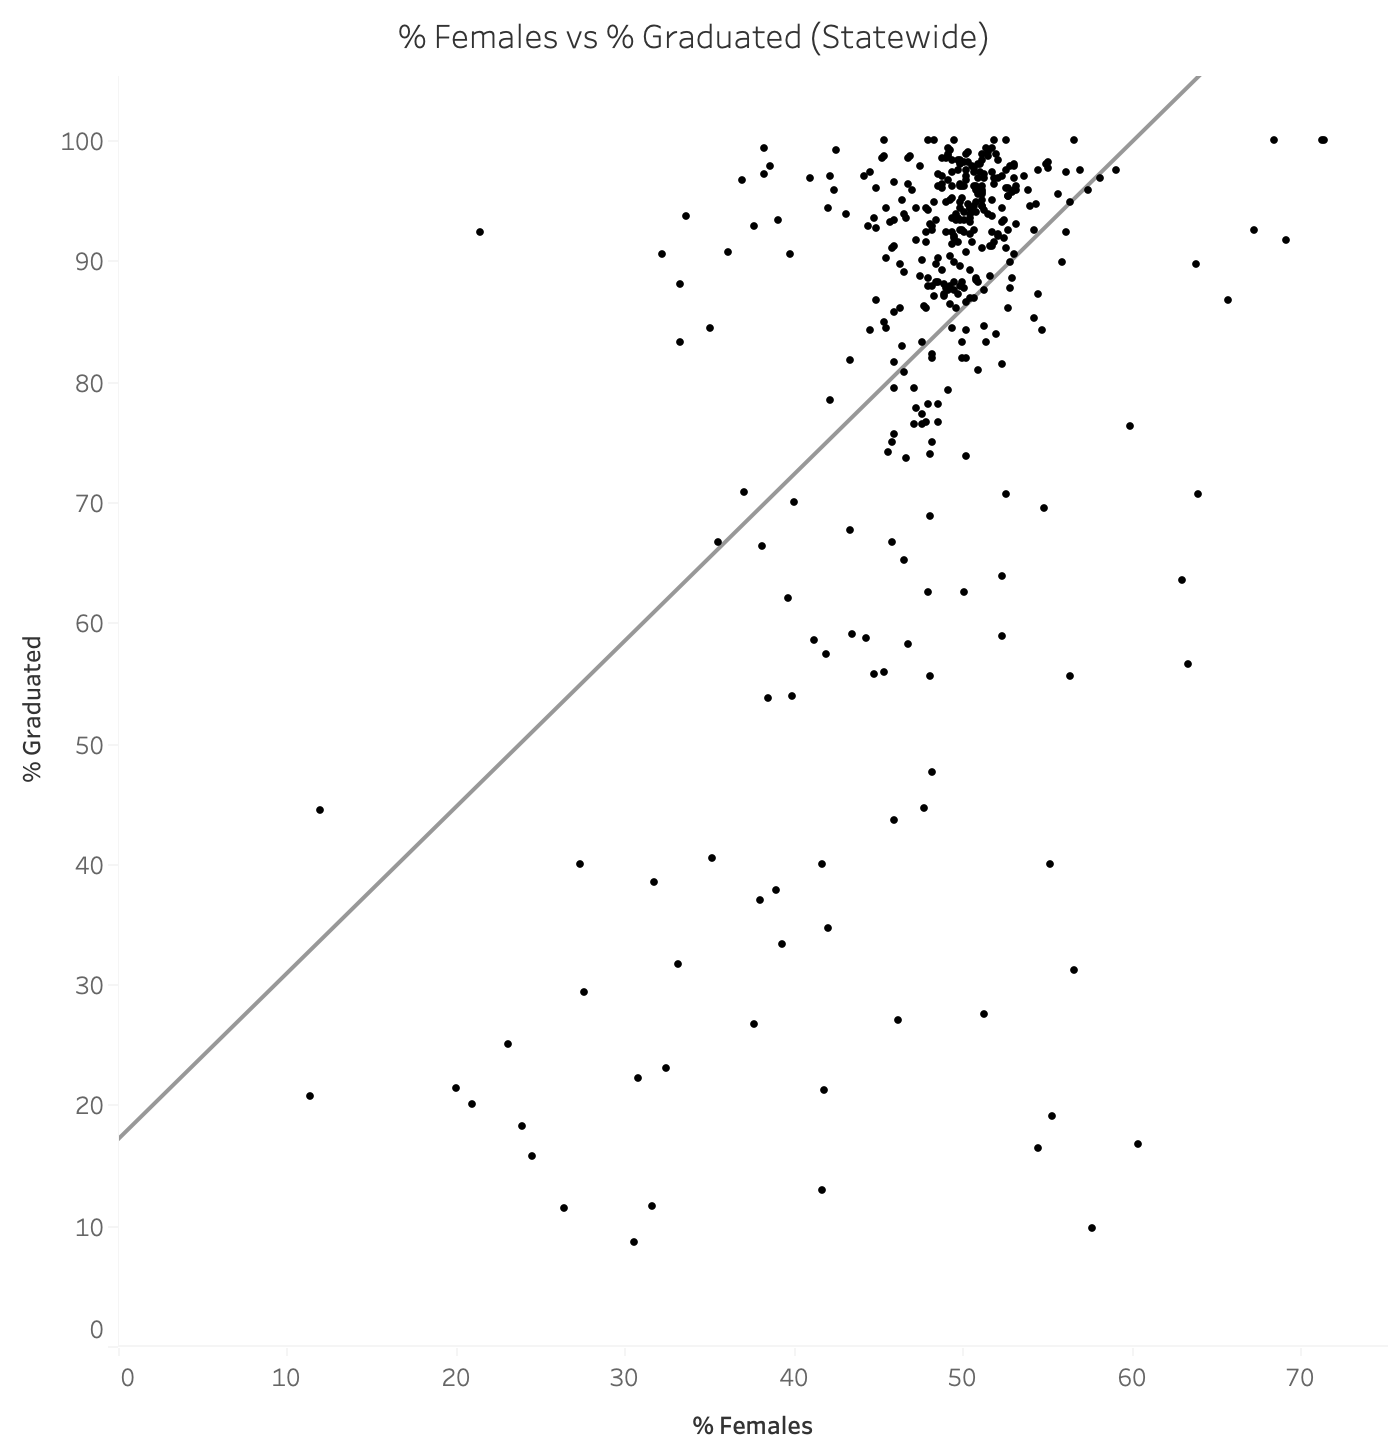
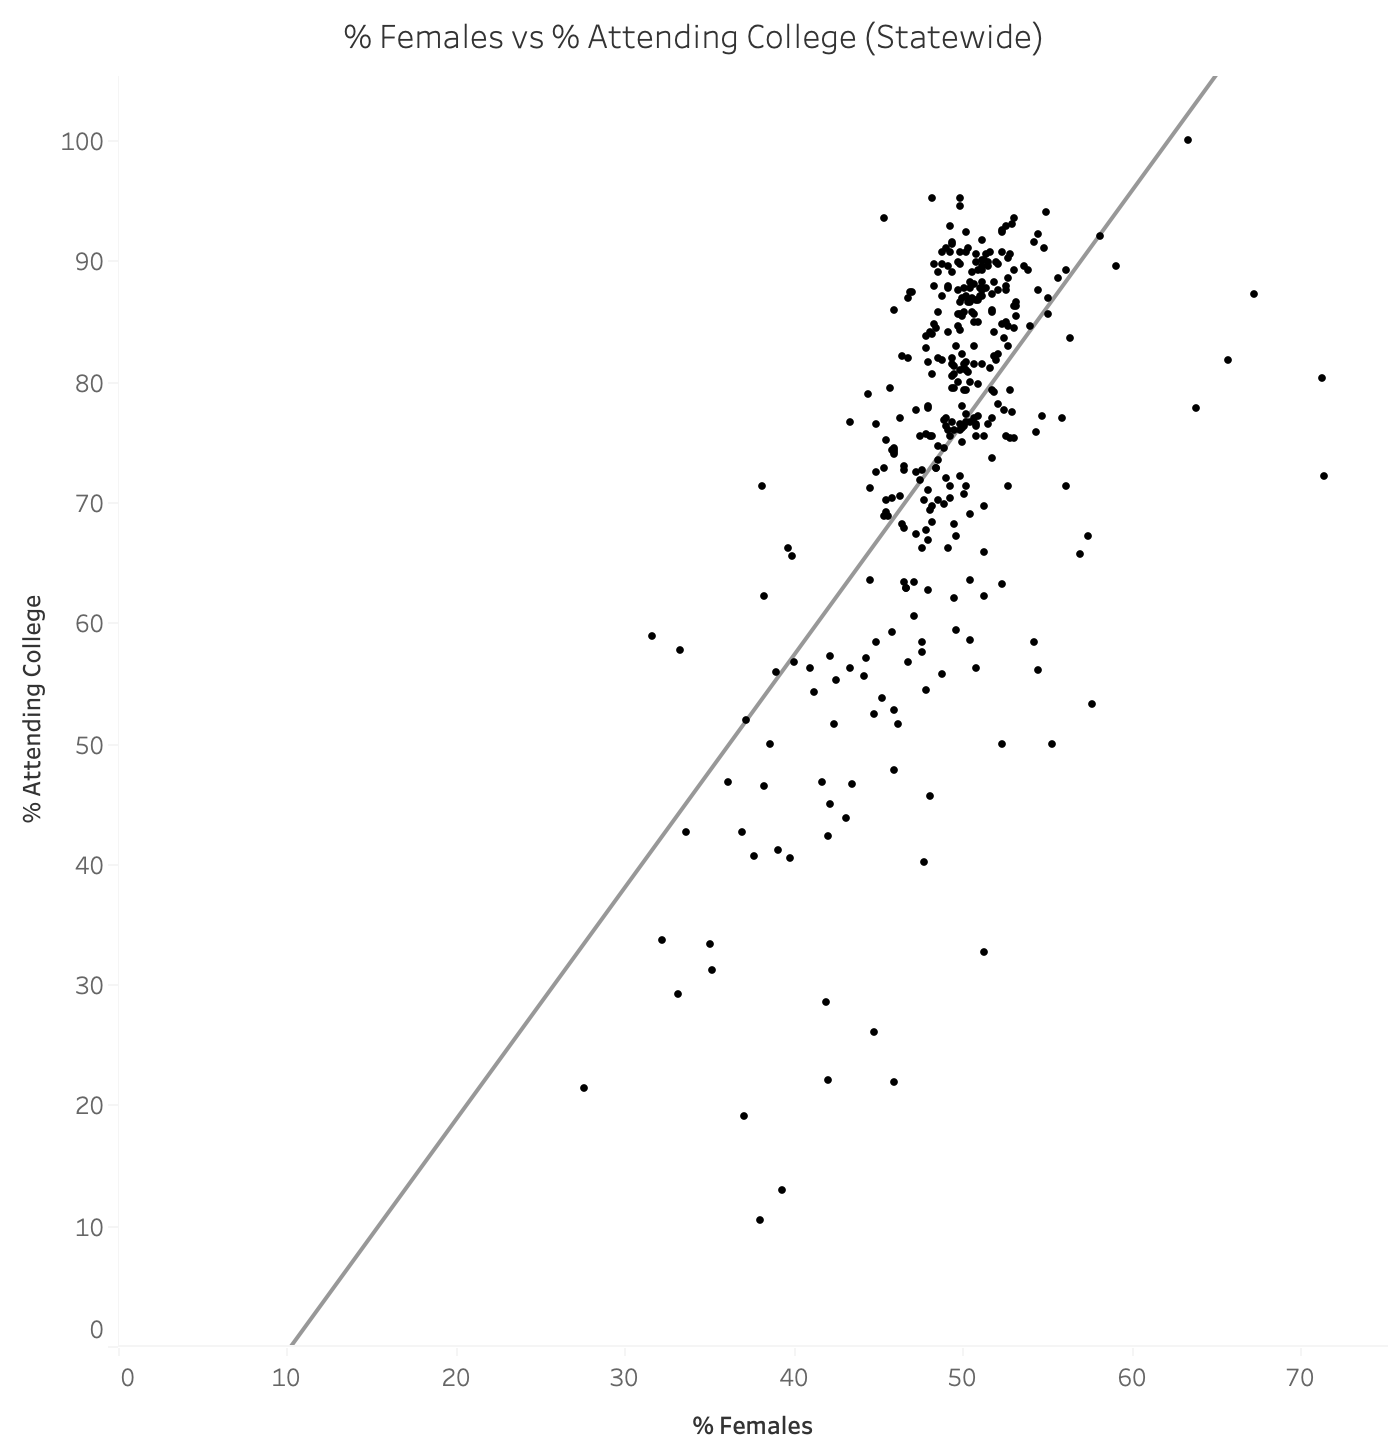
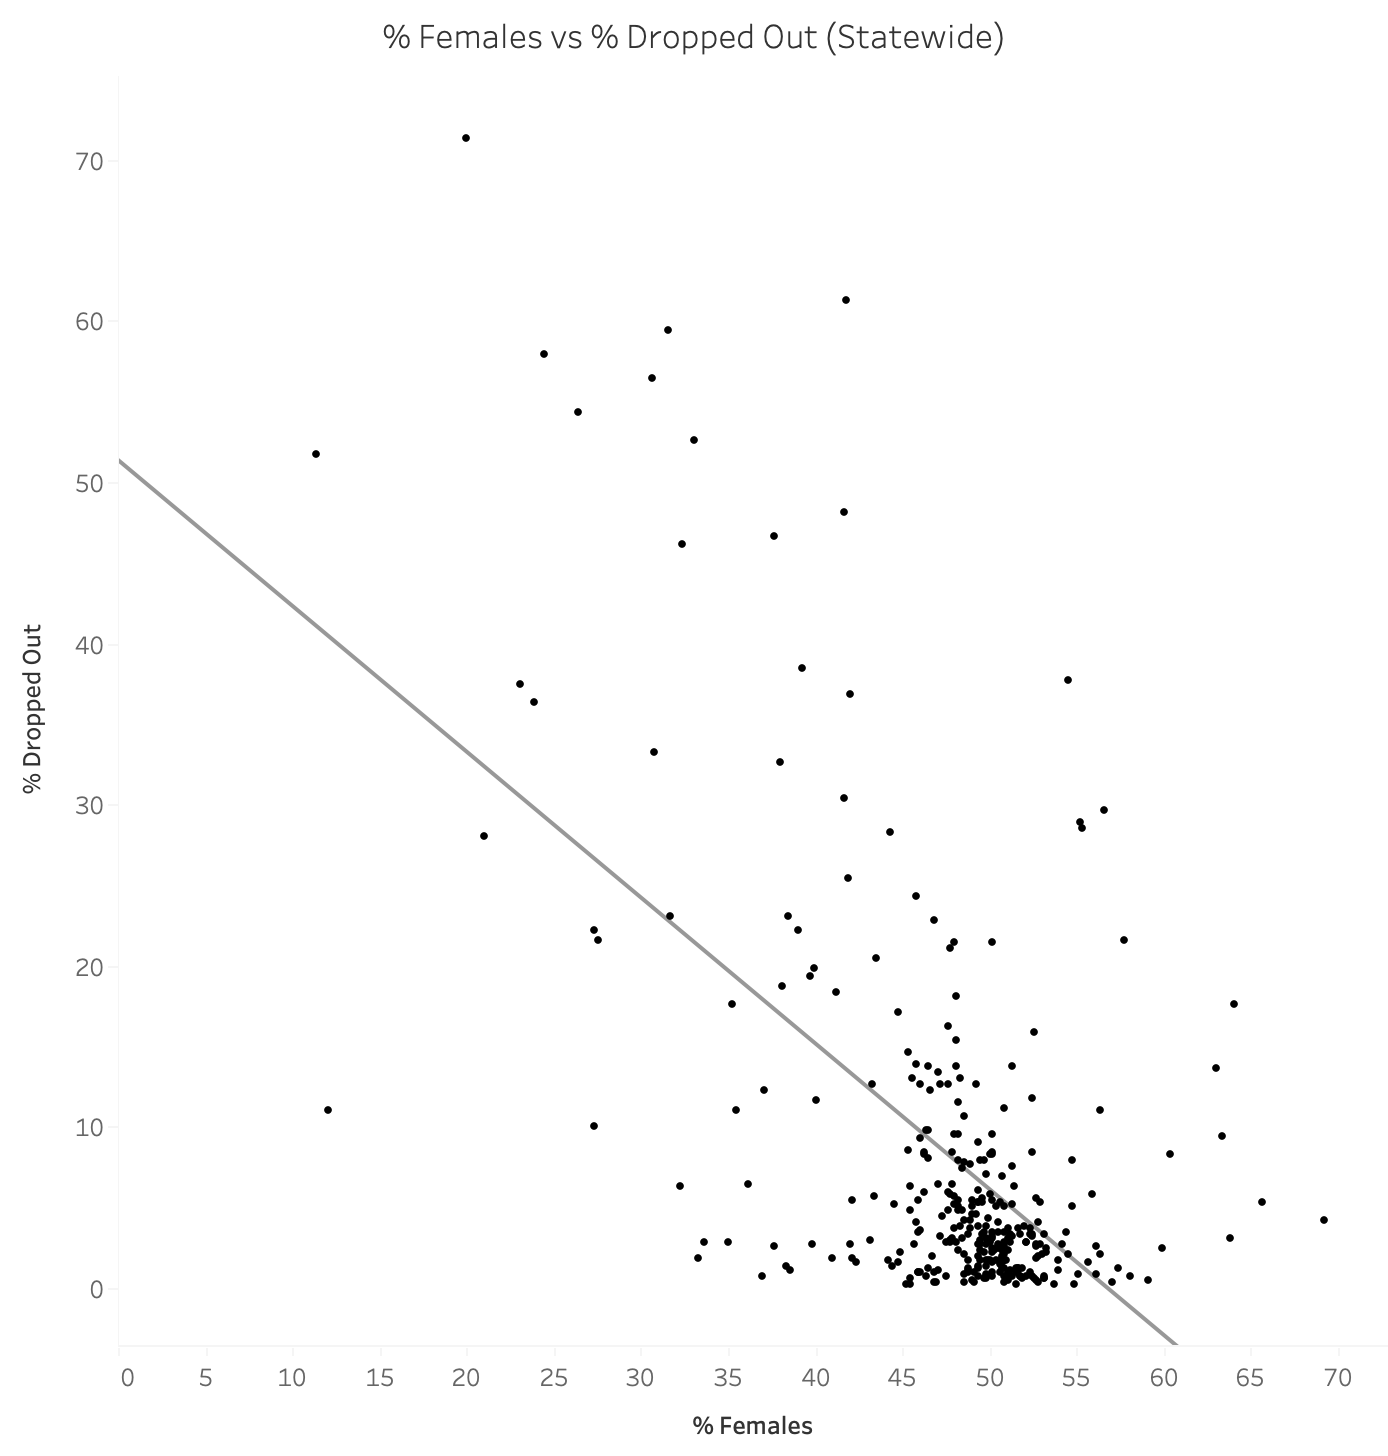
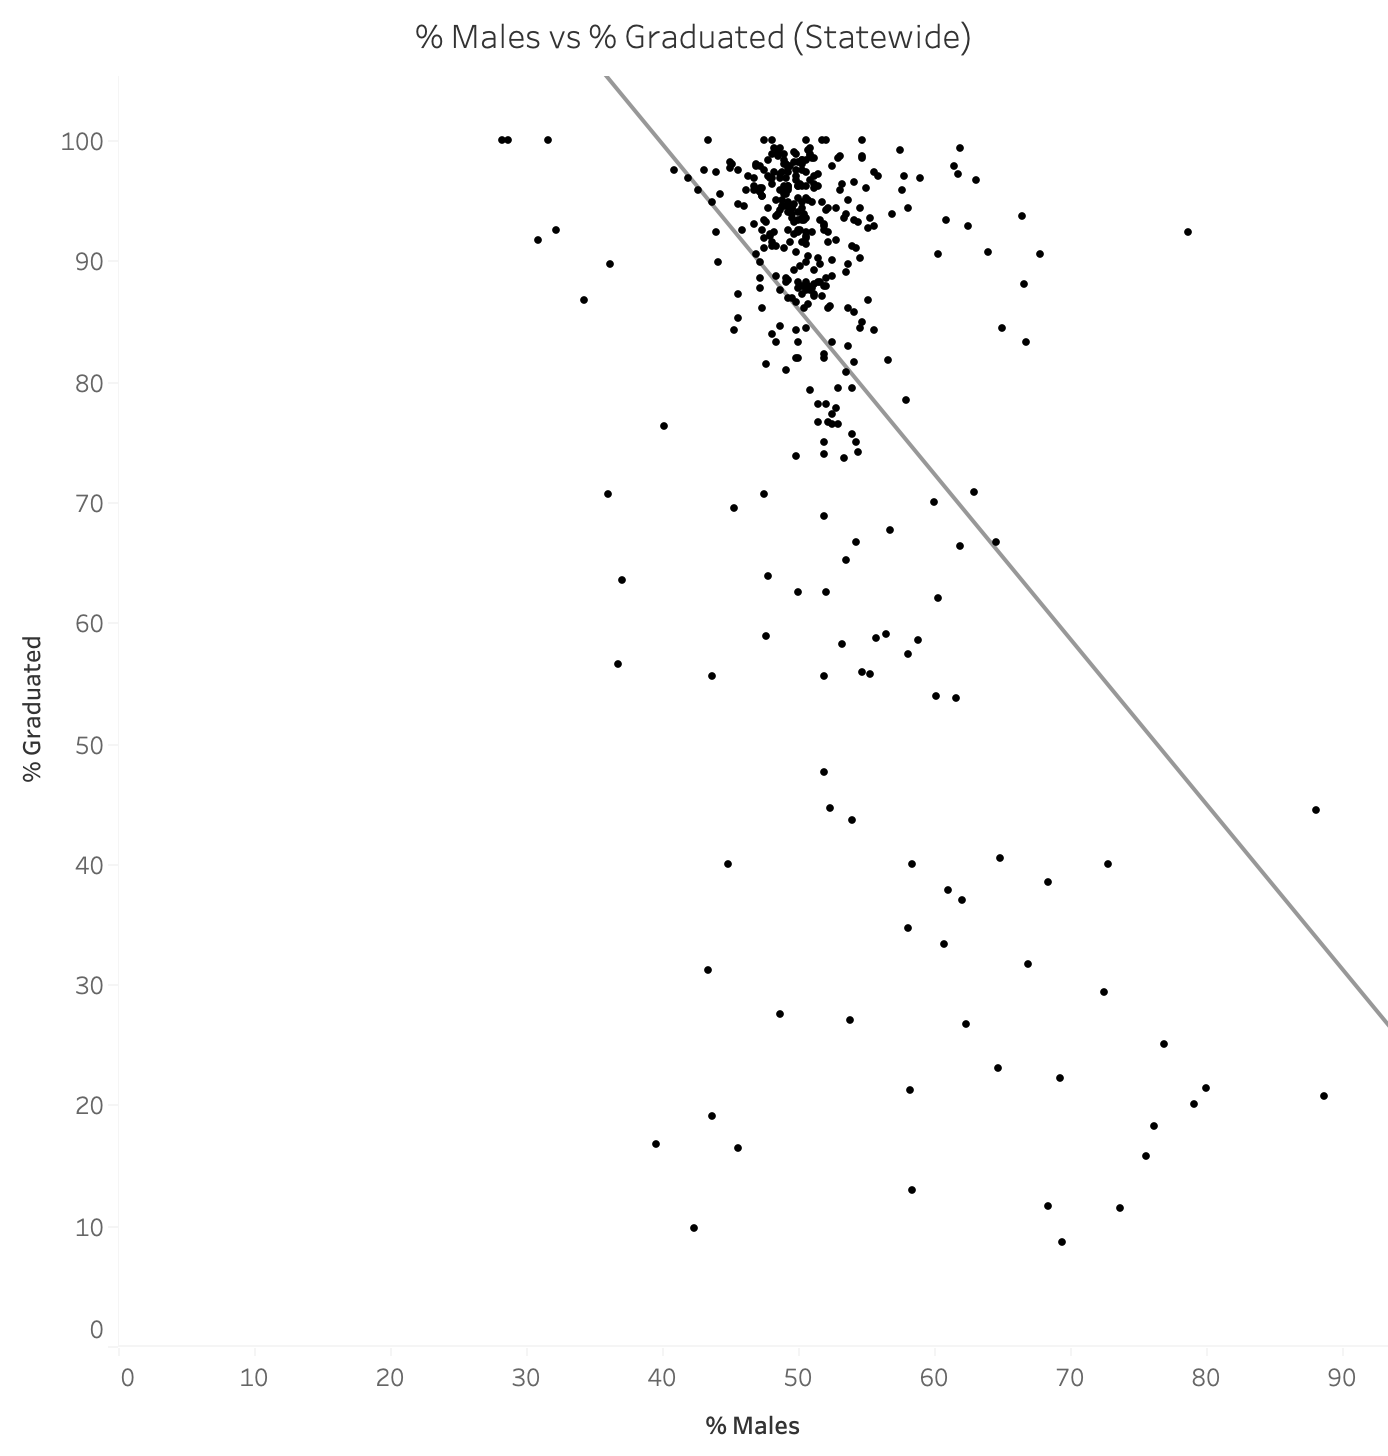
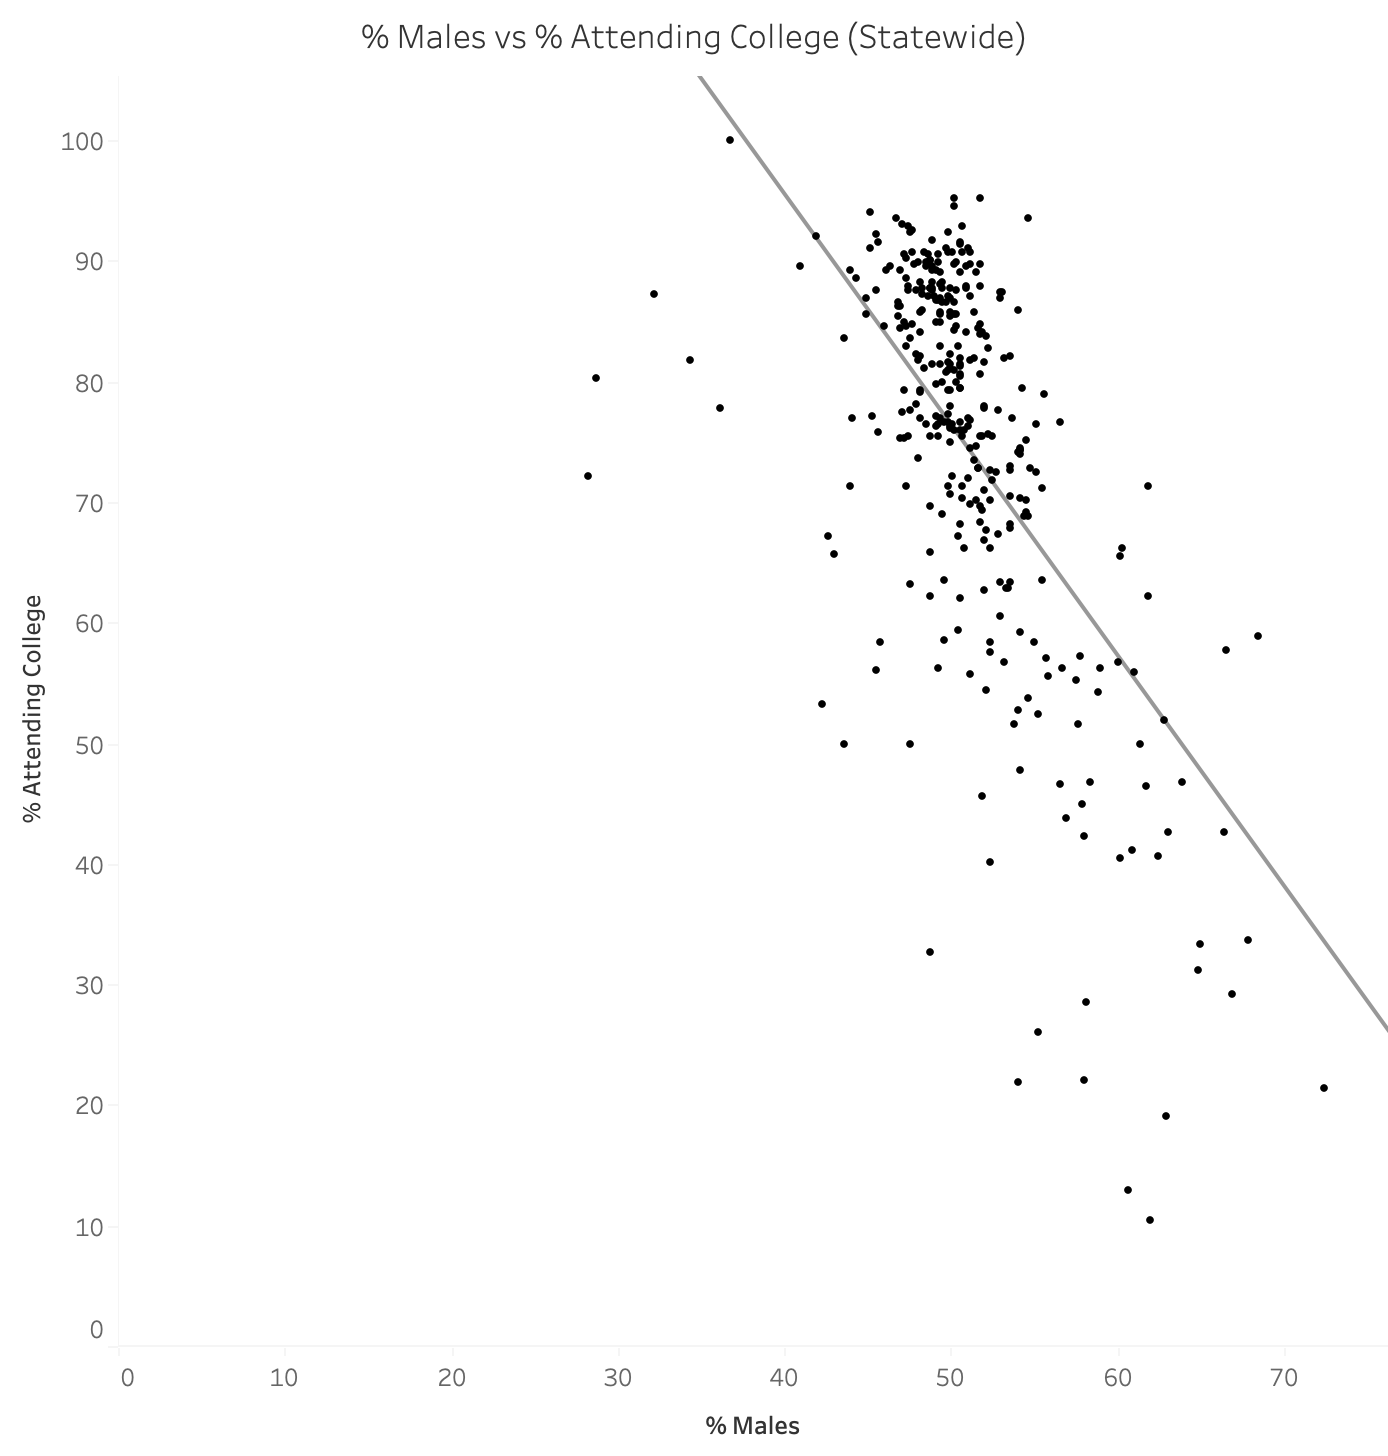
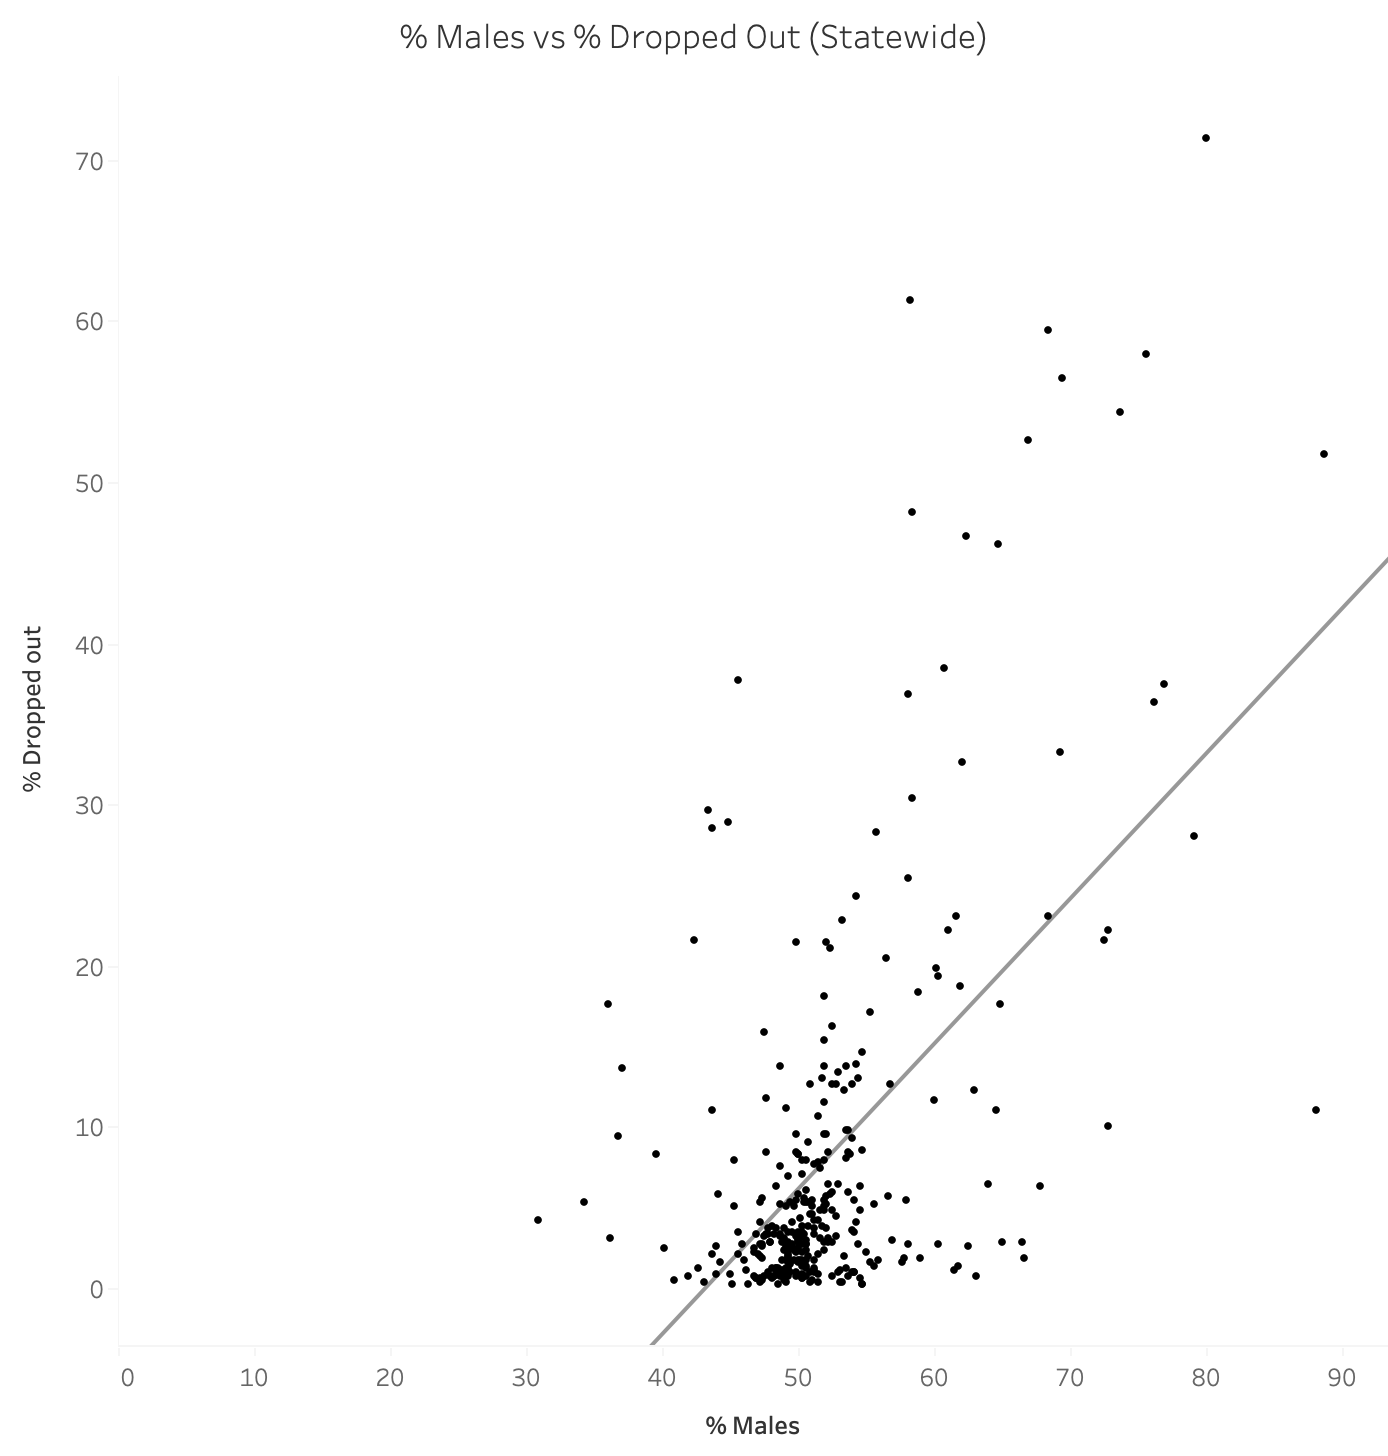
- Schools with a higher share of male students generally have lower graduation and college attendance rates and higher dropout rates than schools that are more female-dominant, suggesting a gendered dimension to disengagement and attainment.
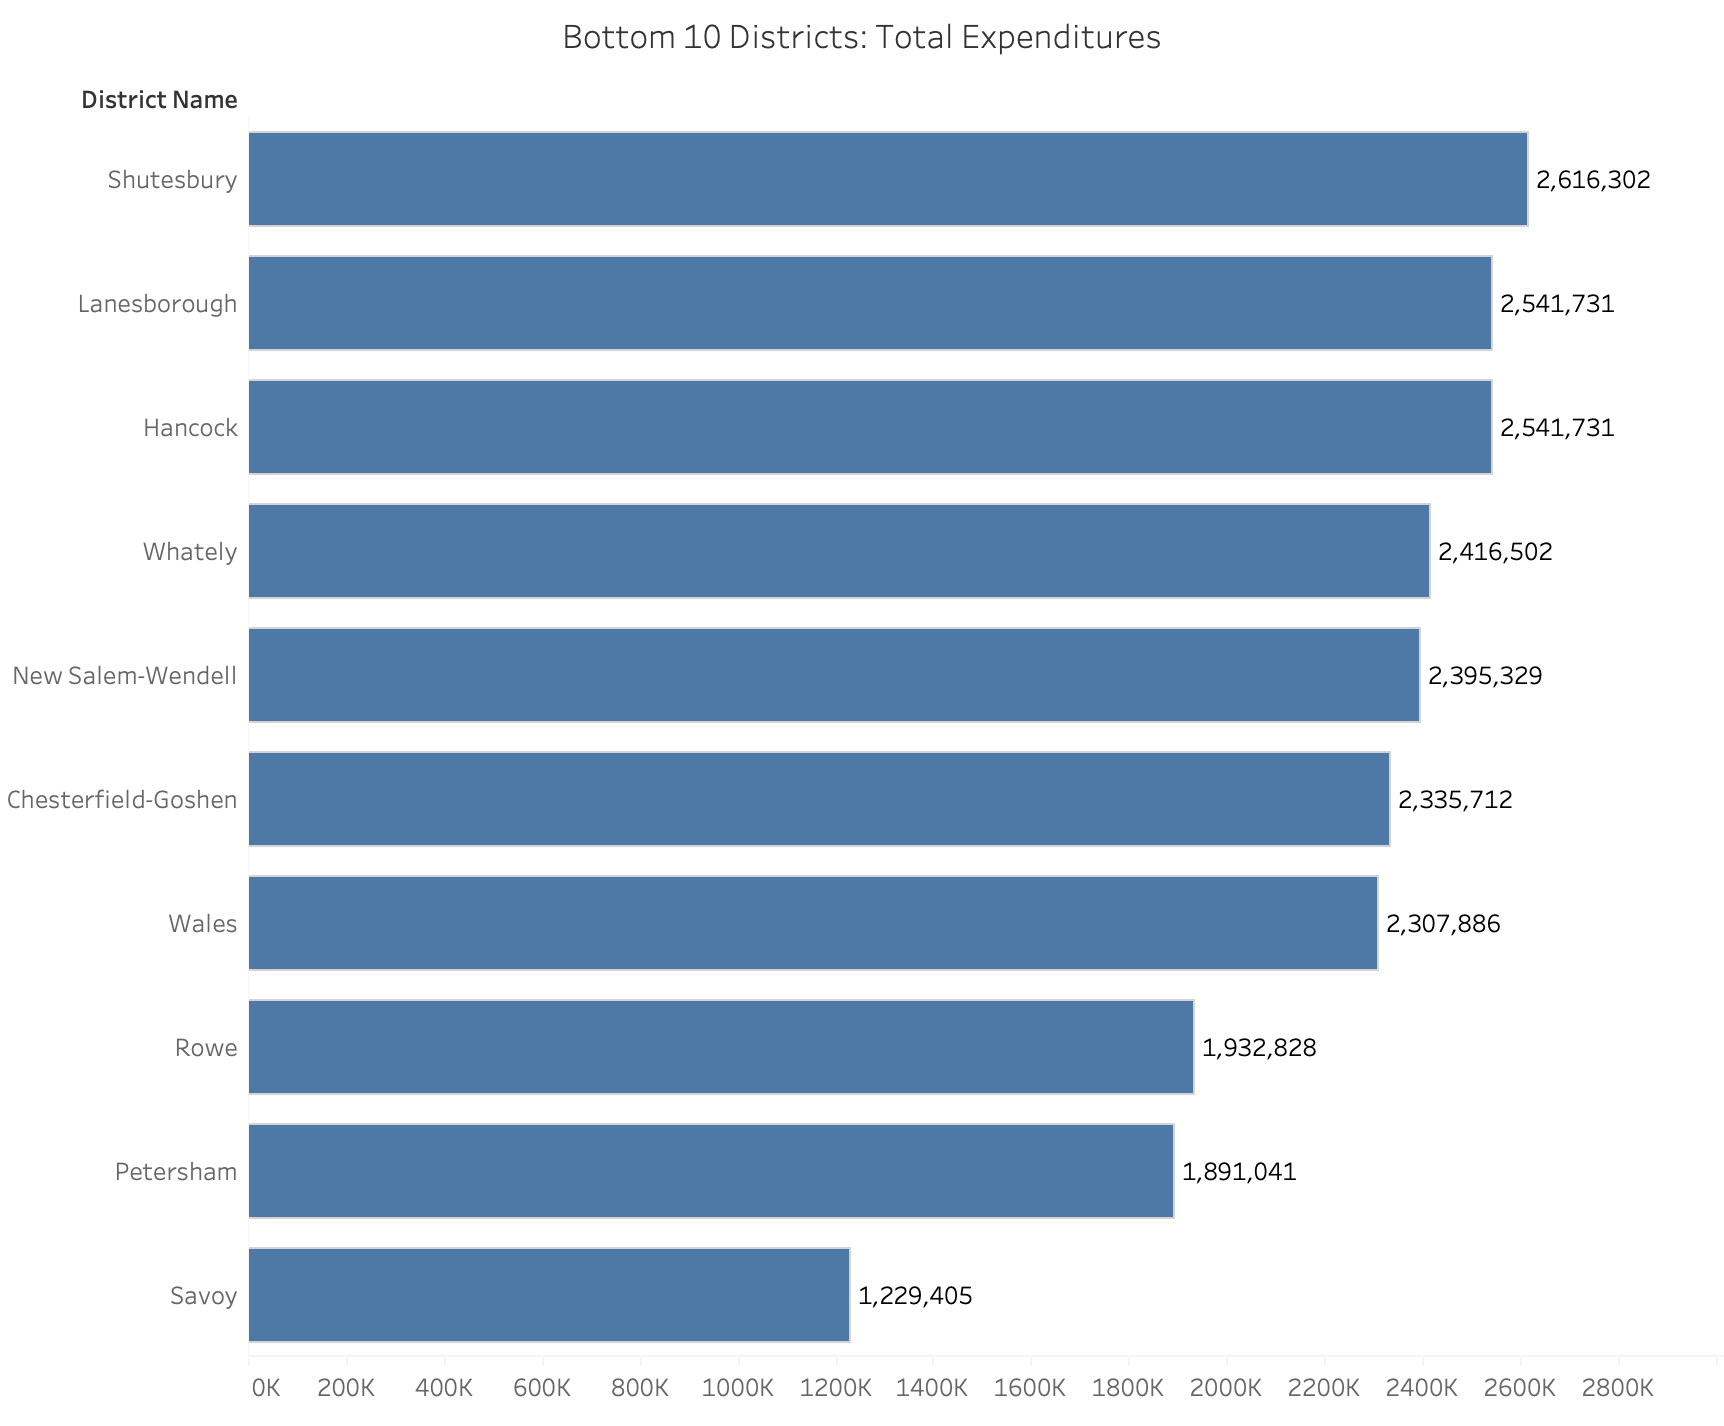
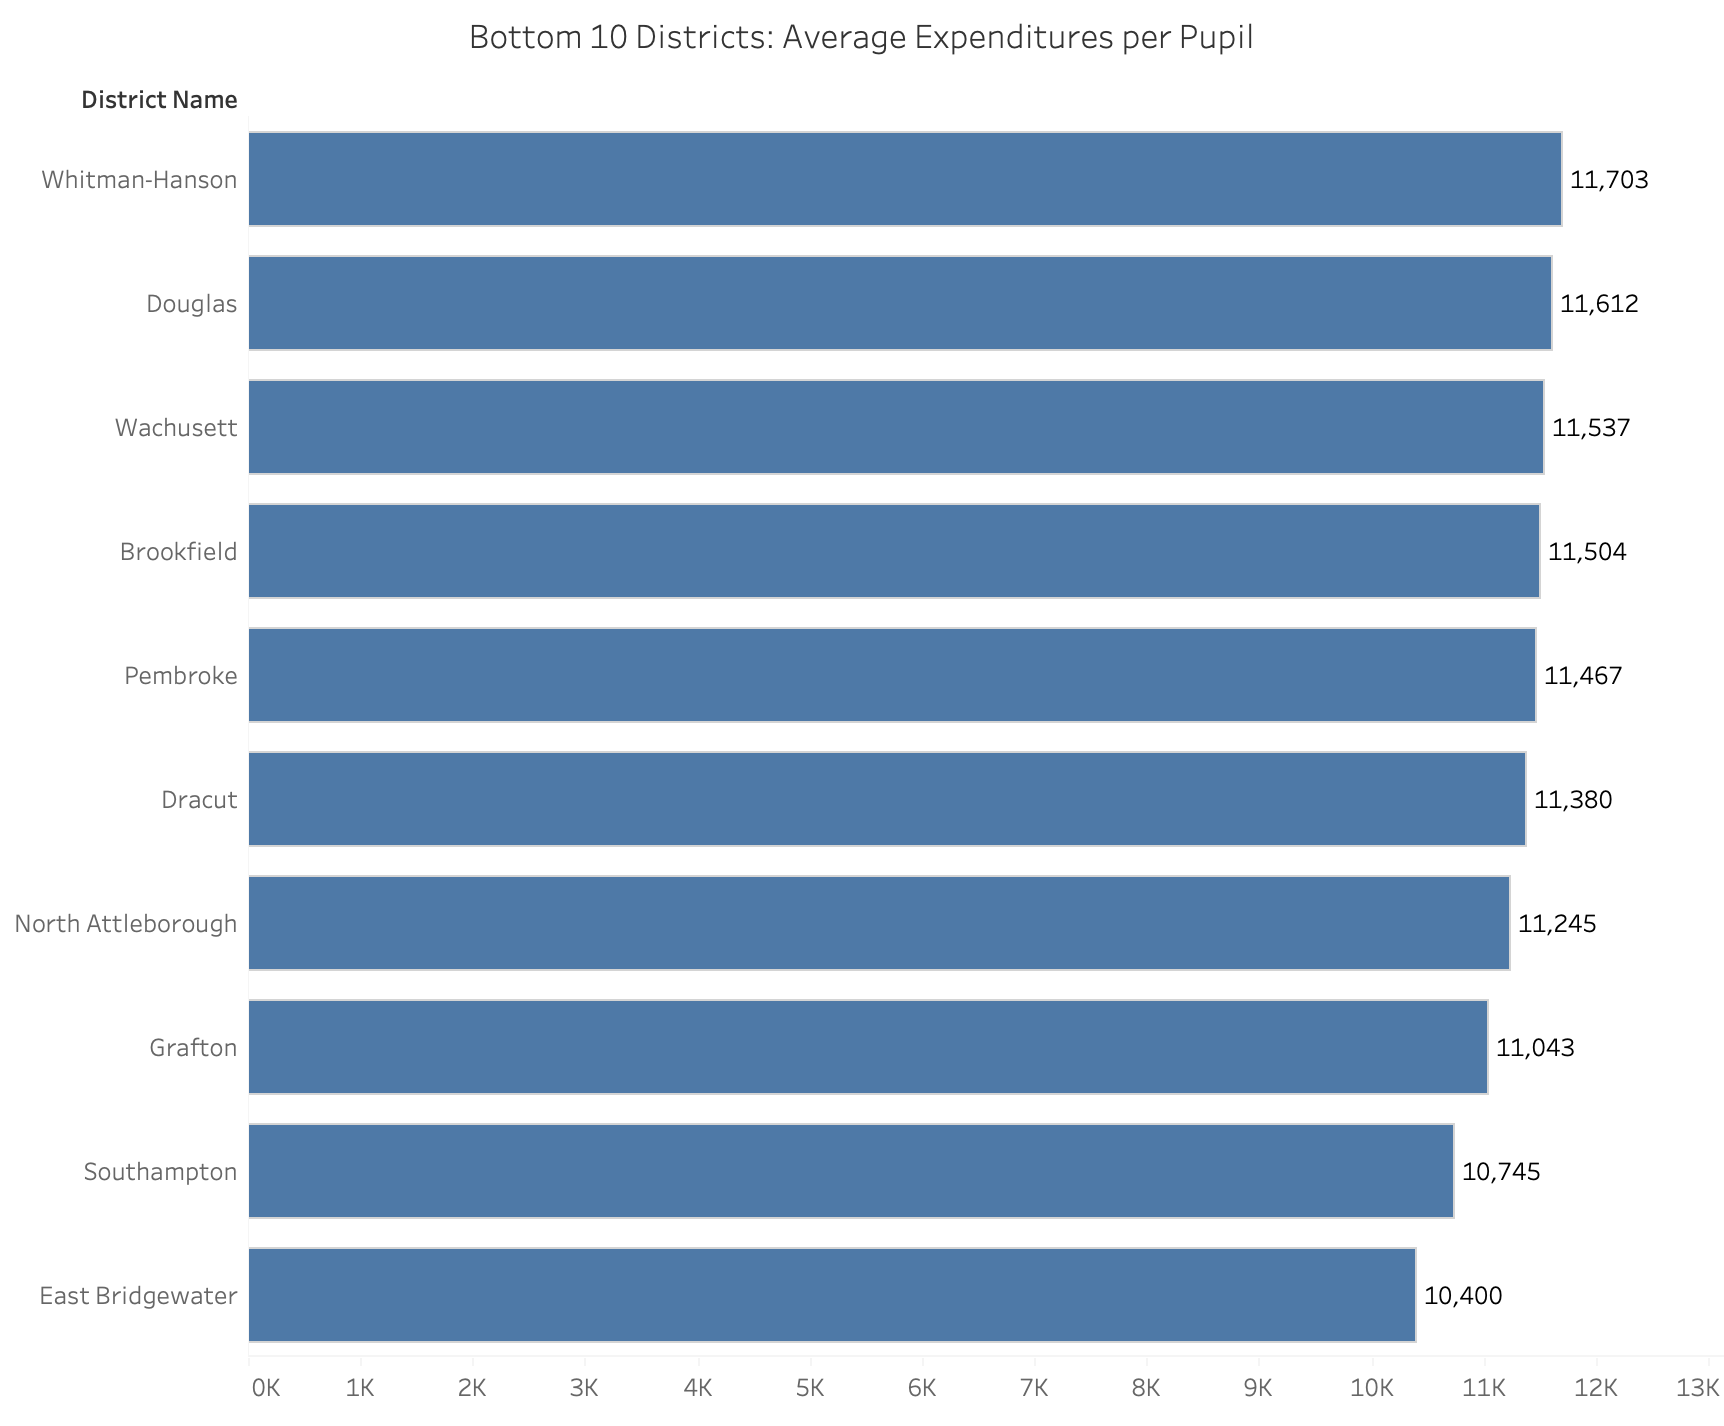
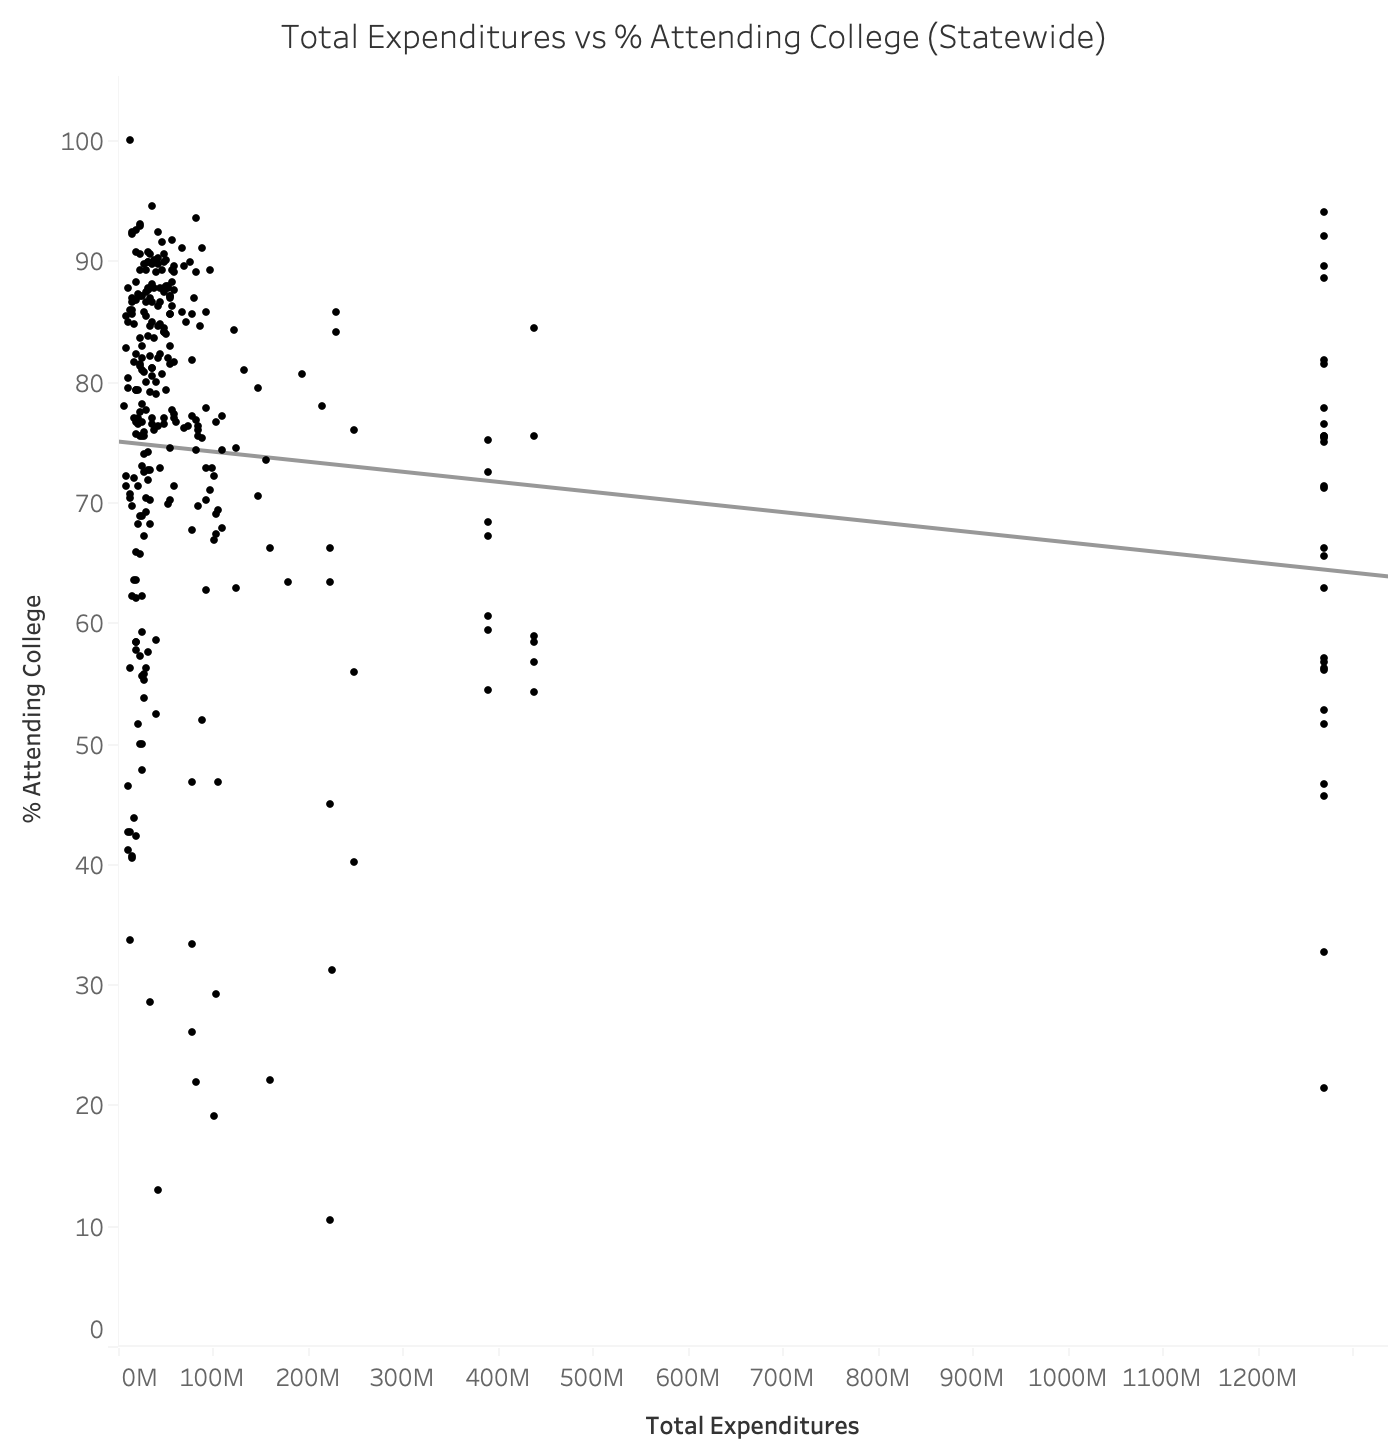
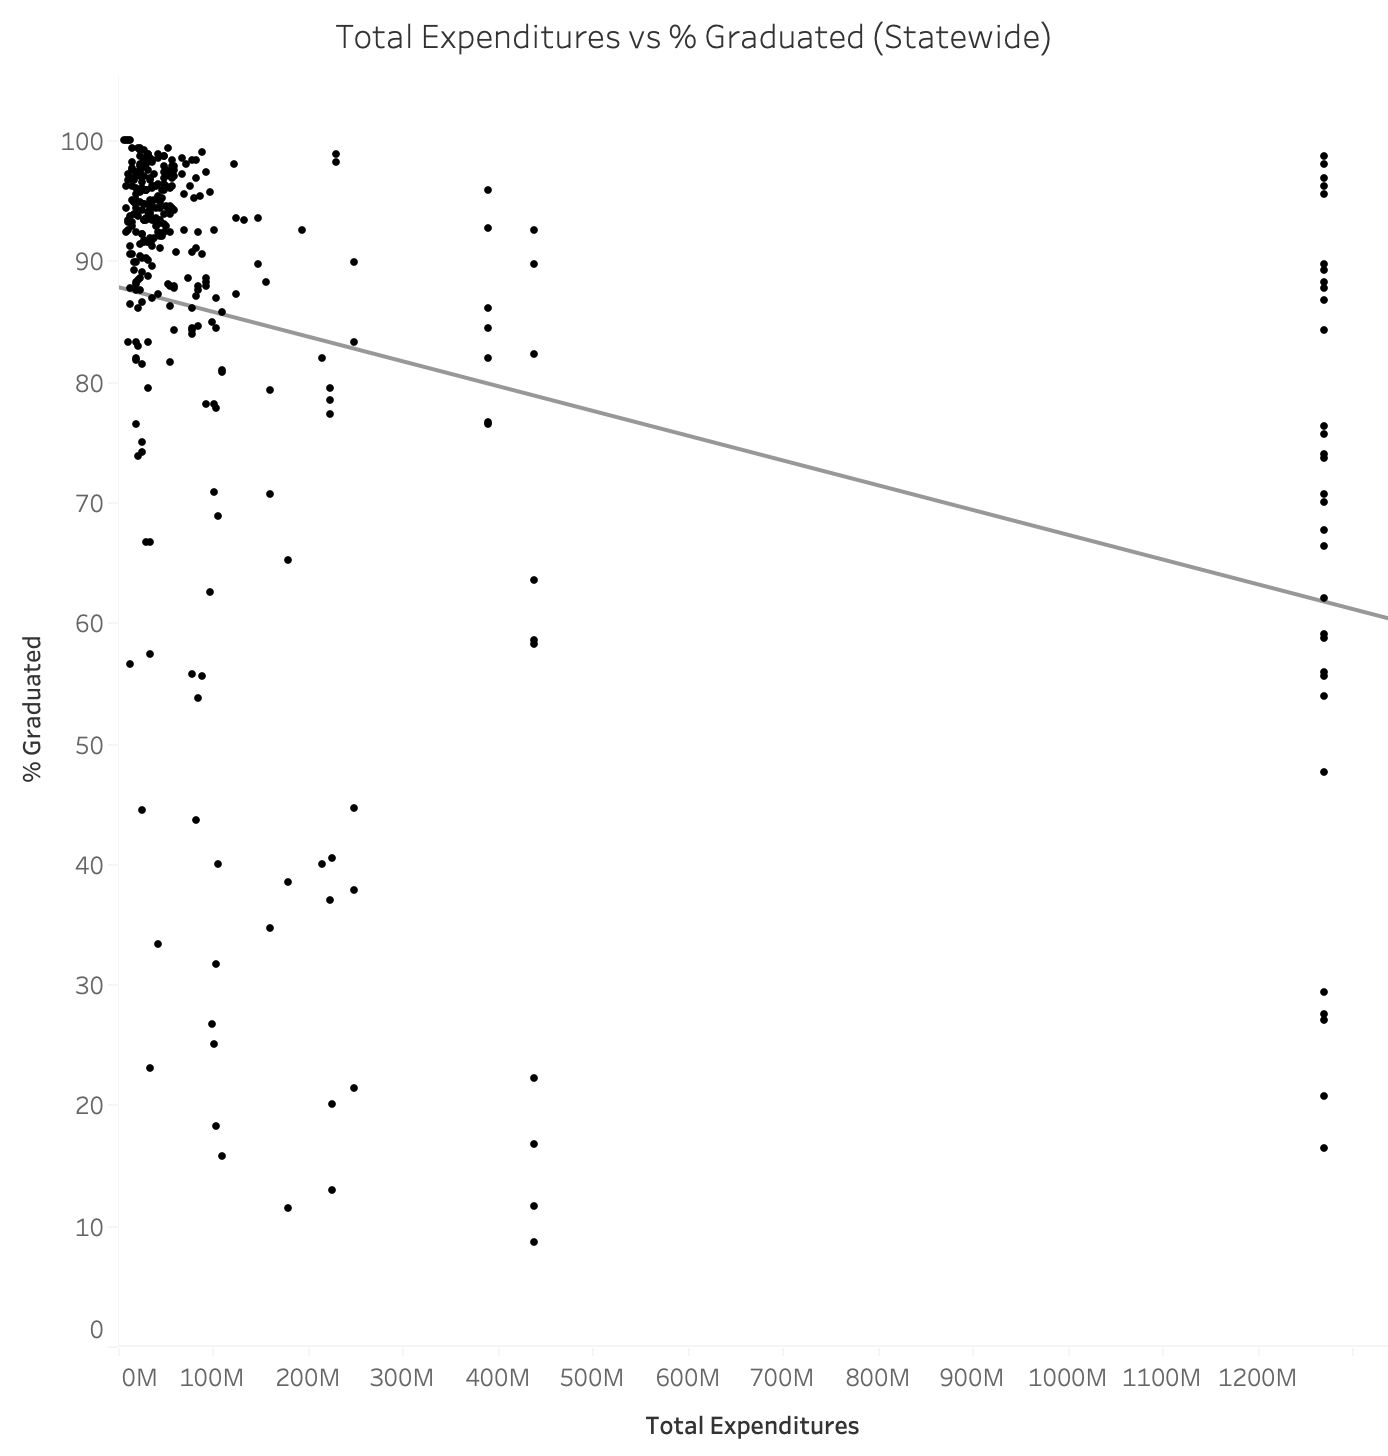
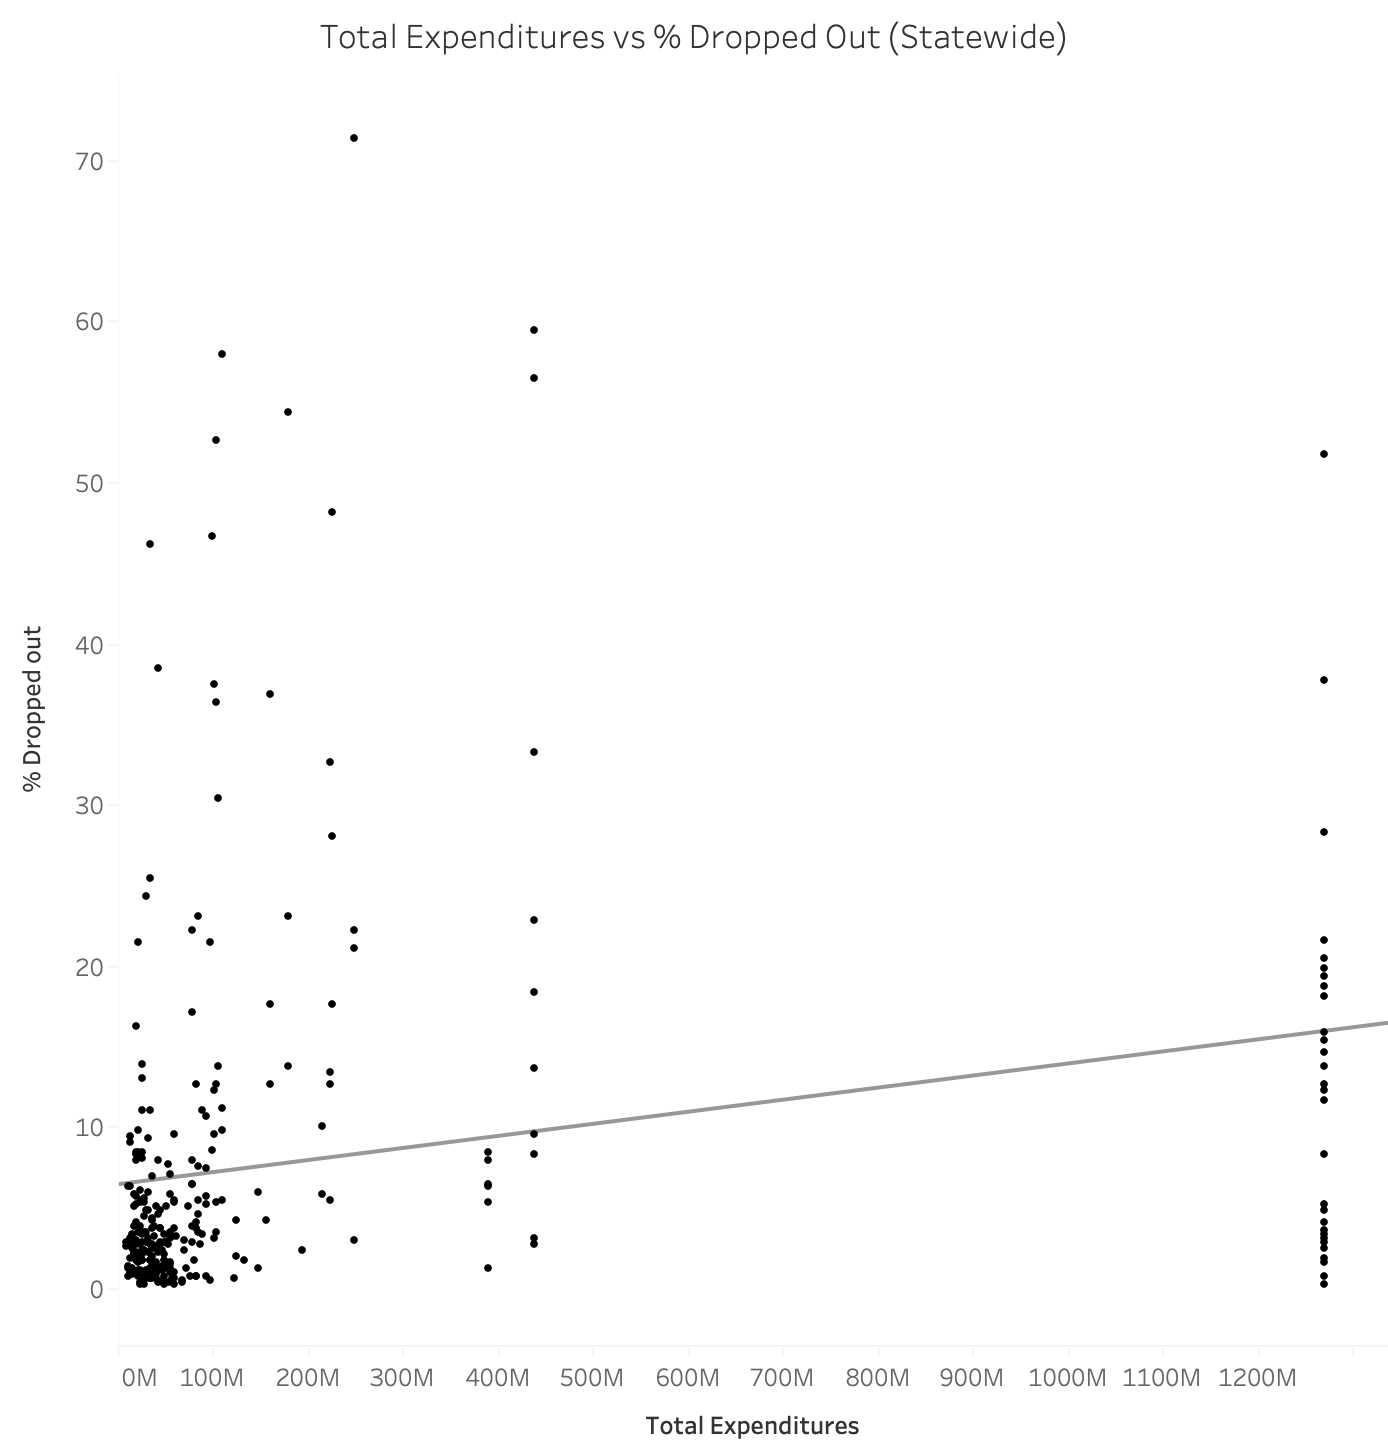
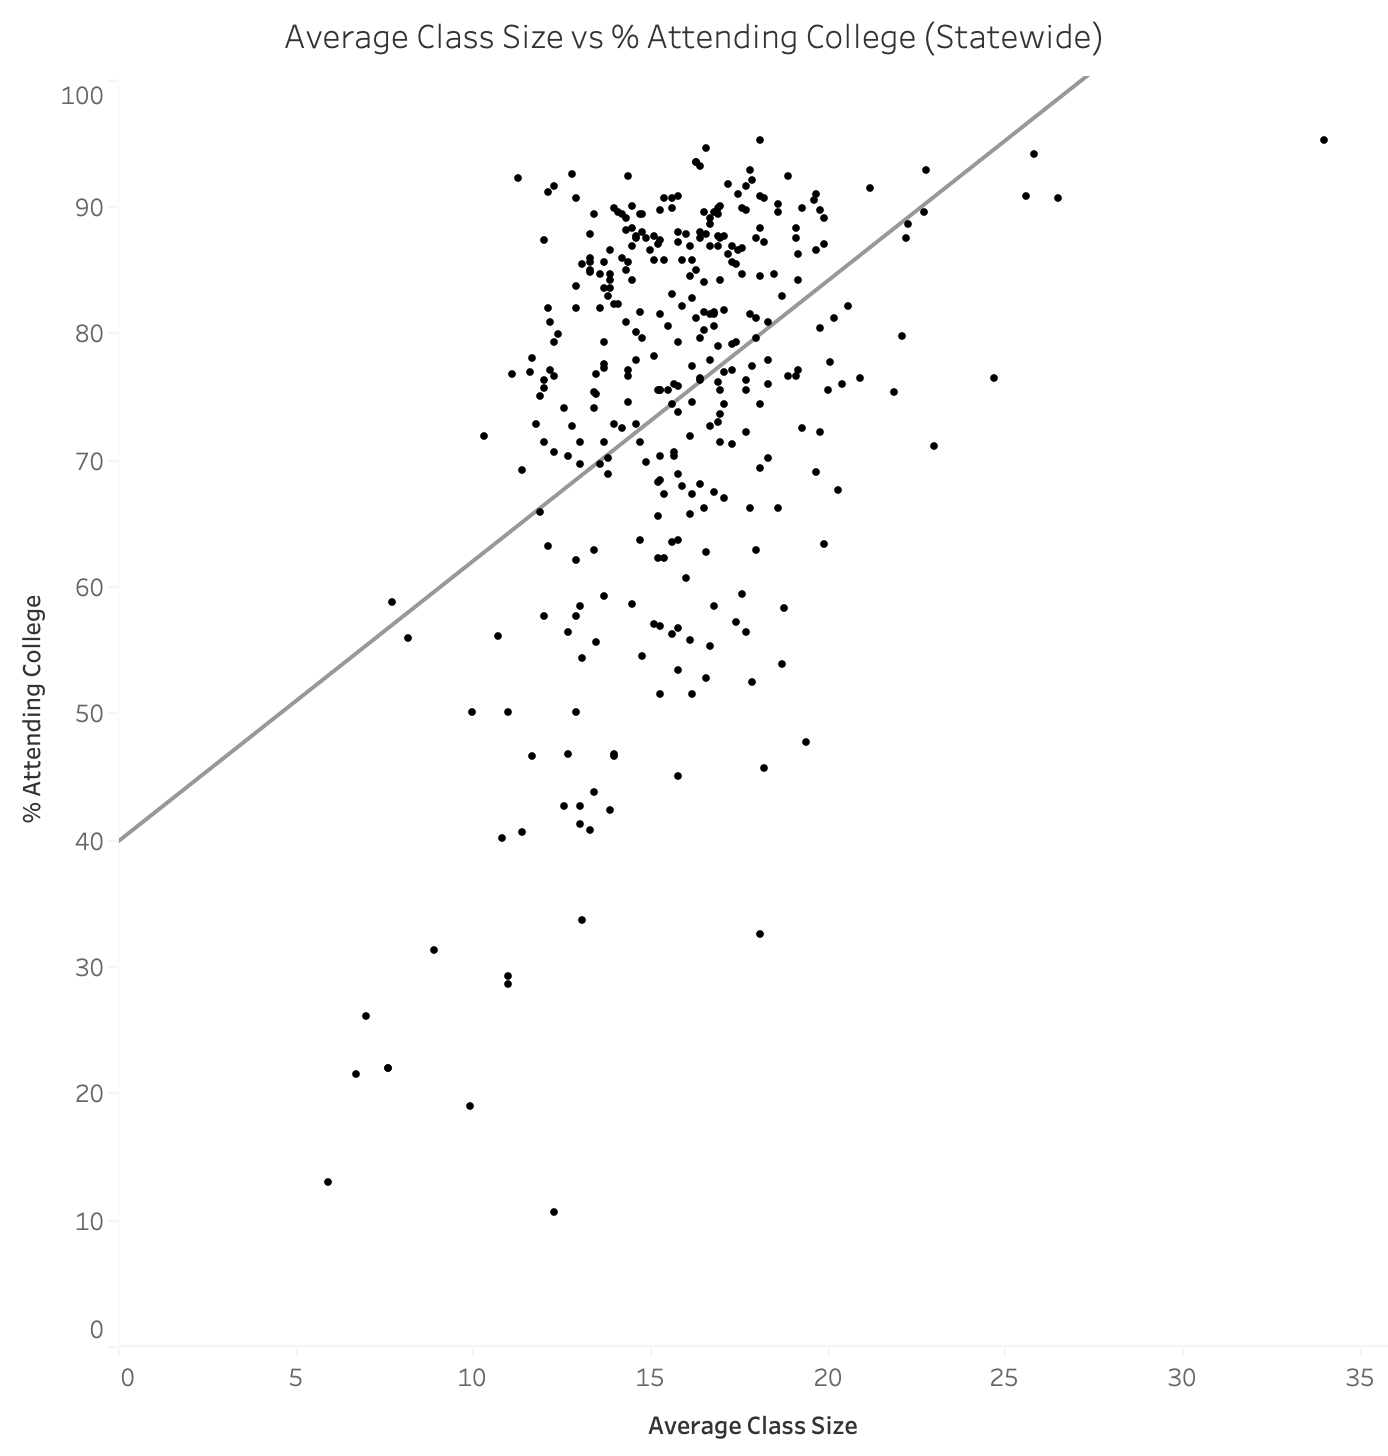
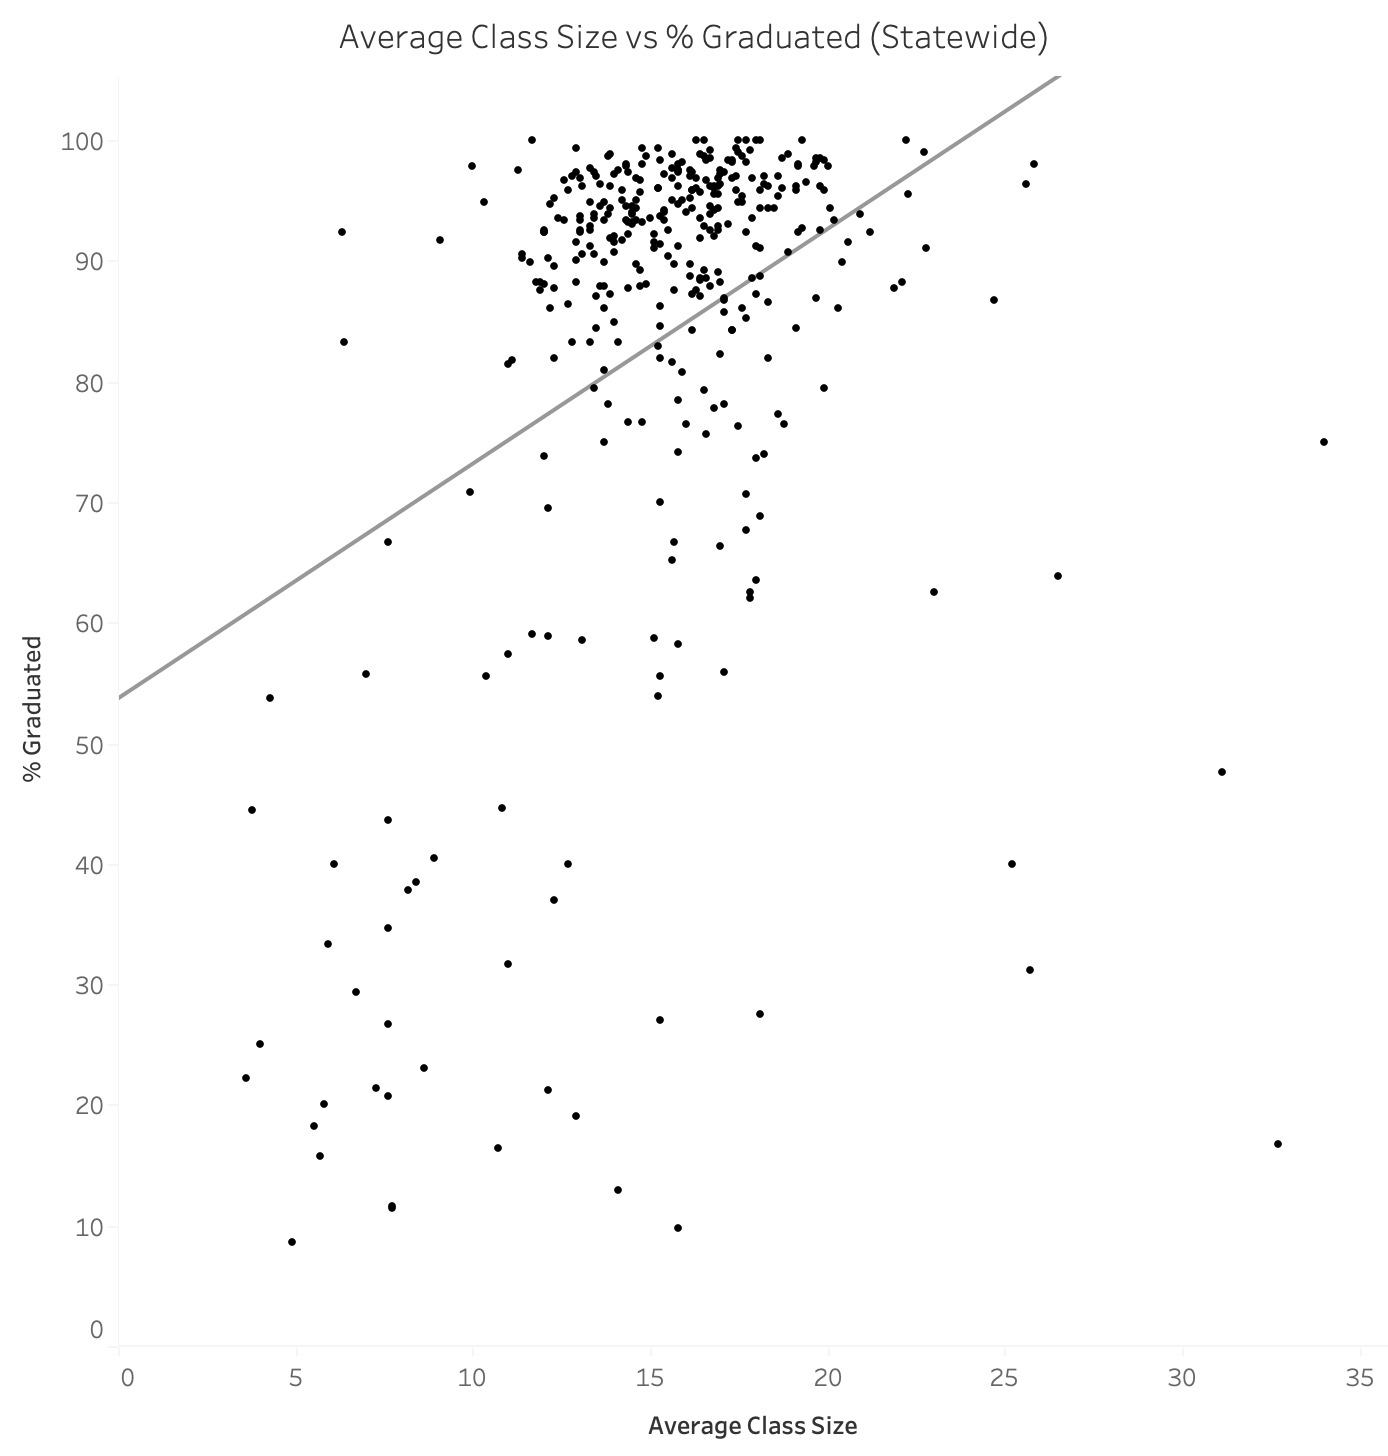
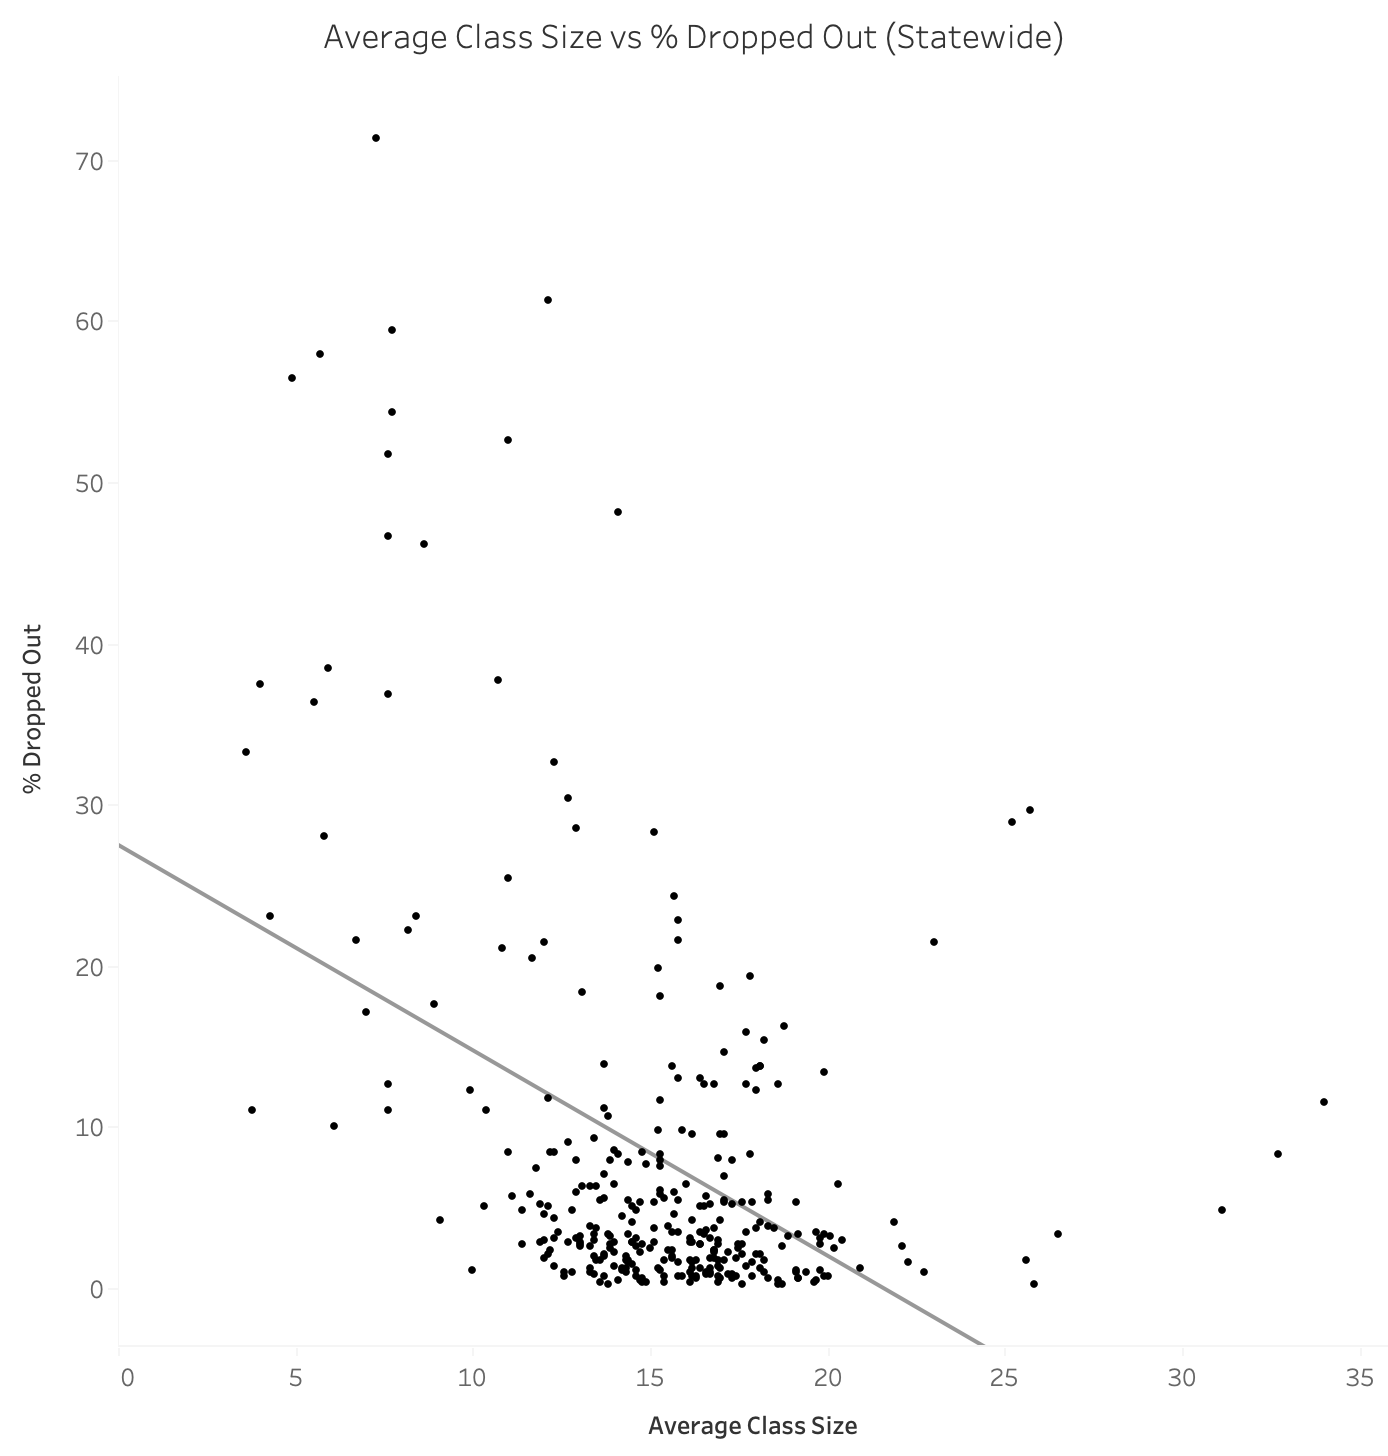
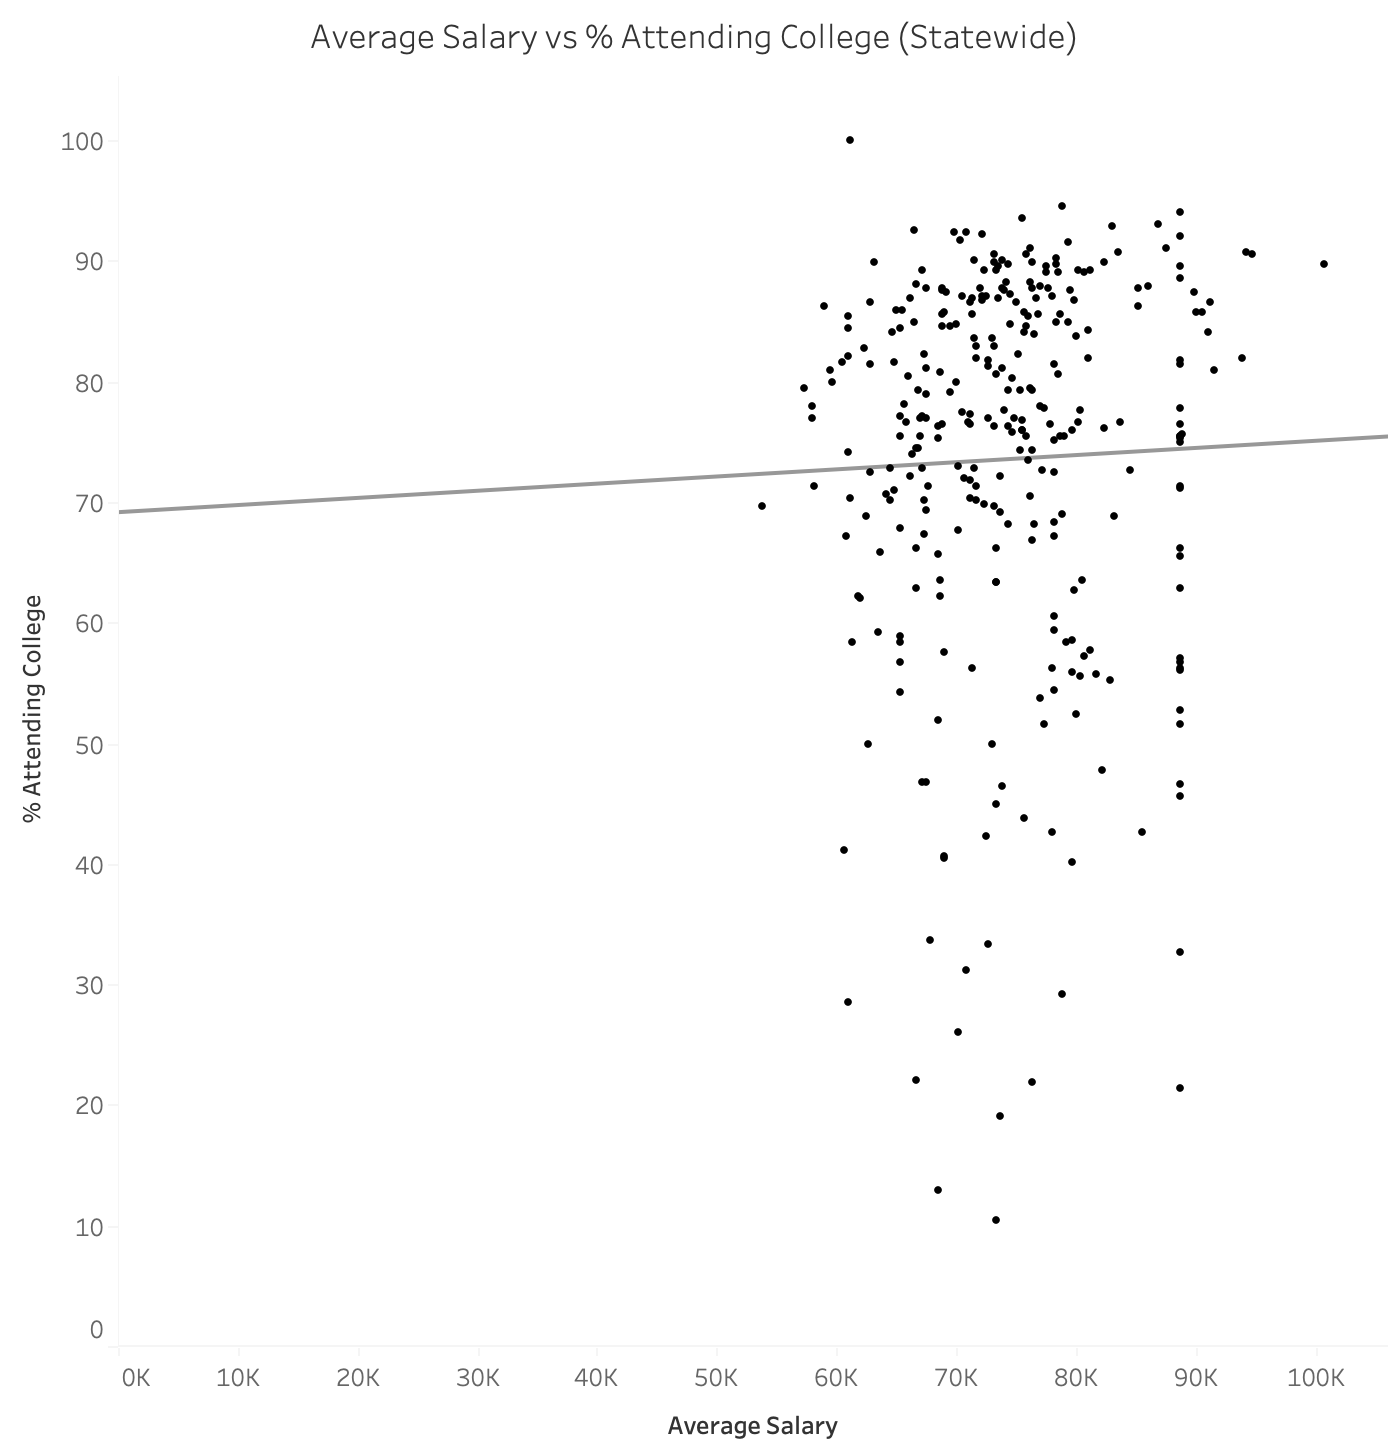
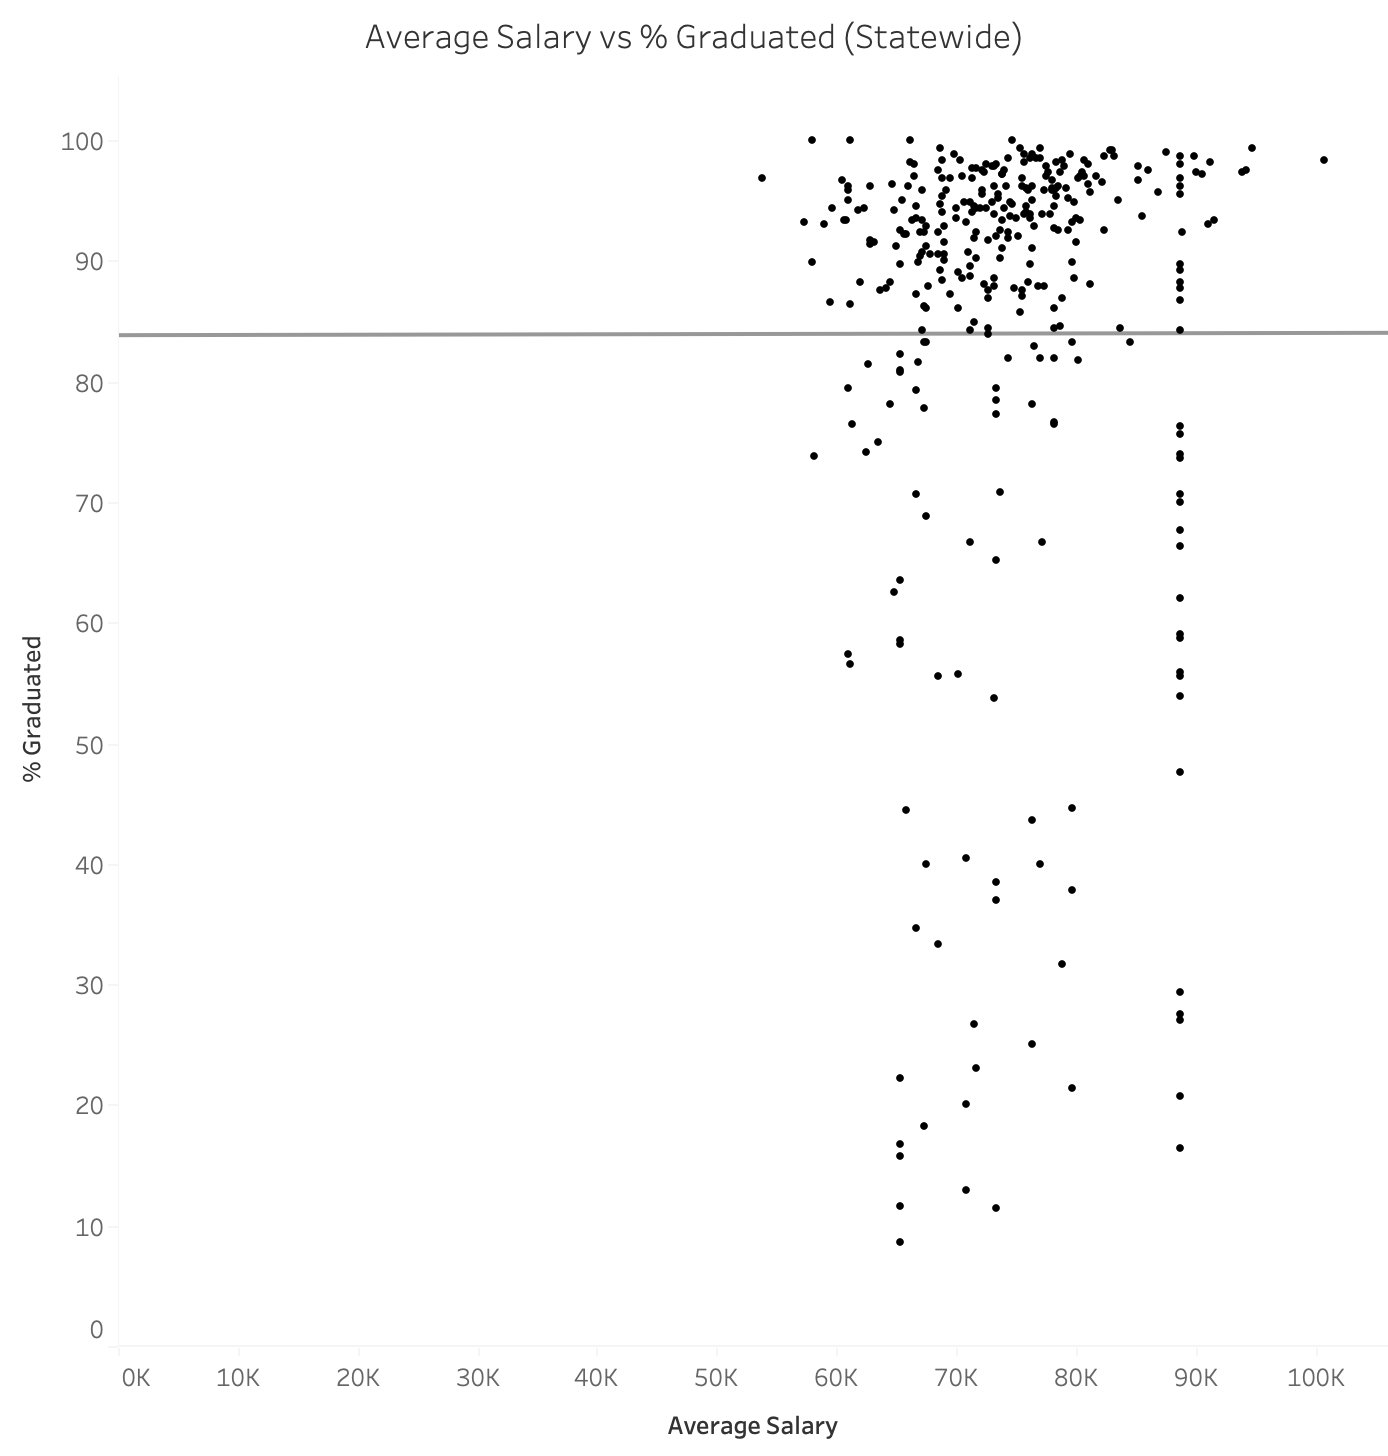
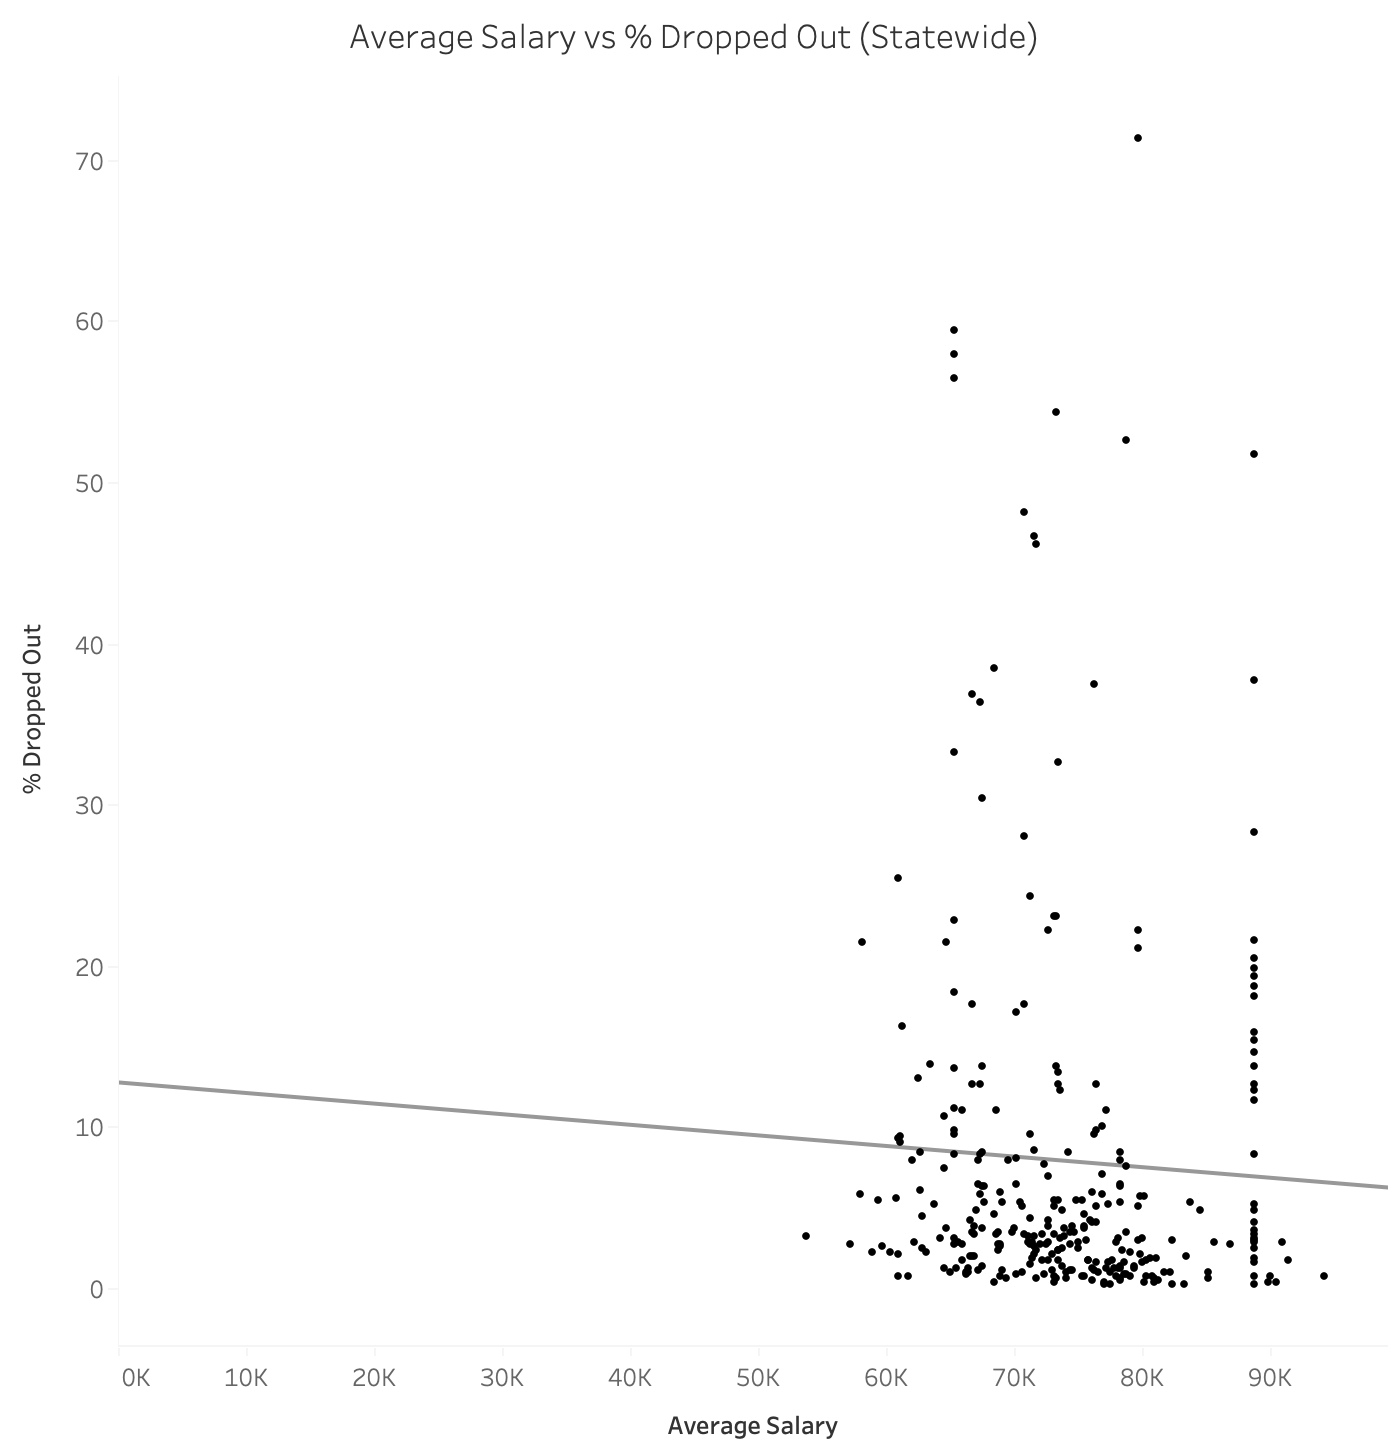
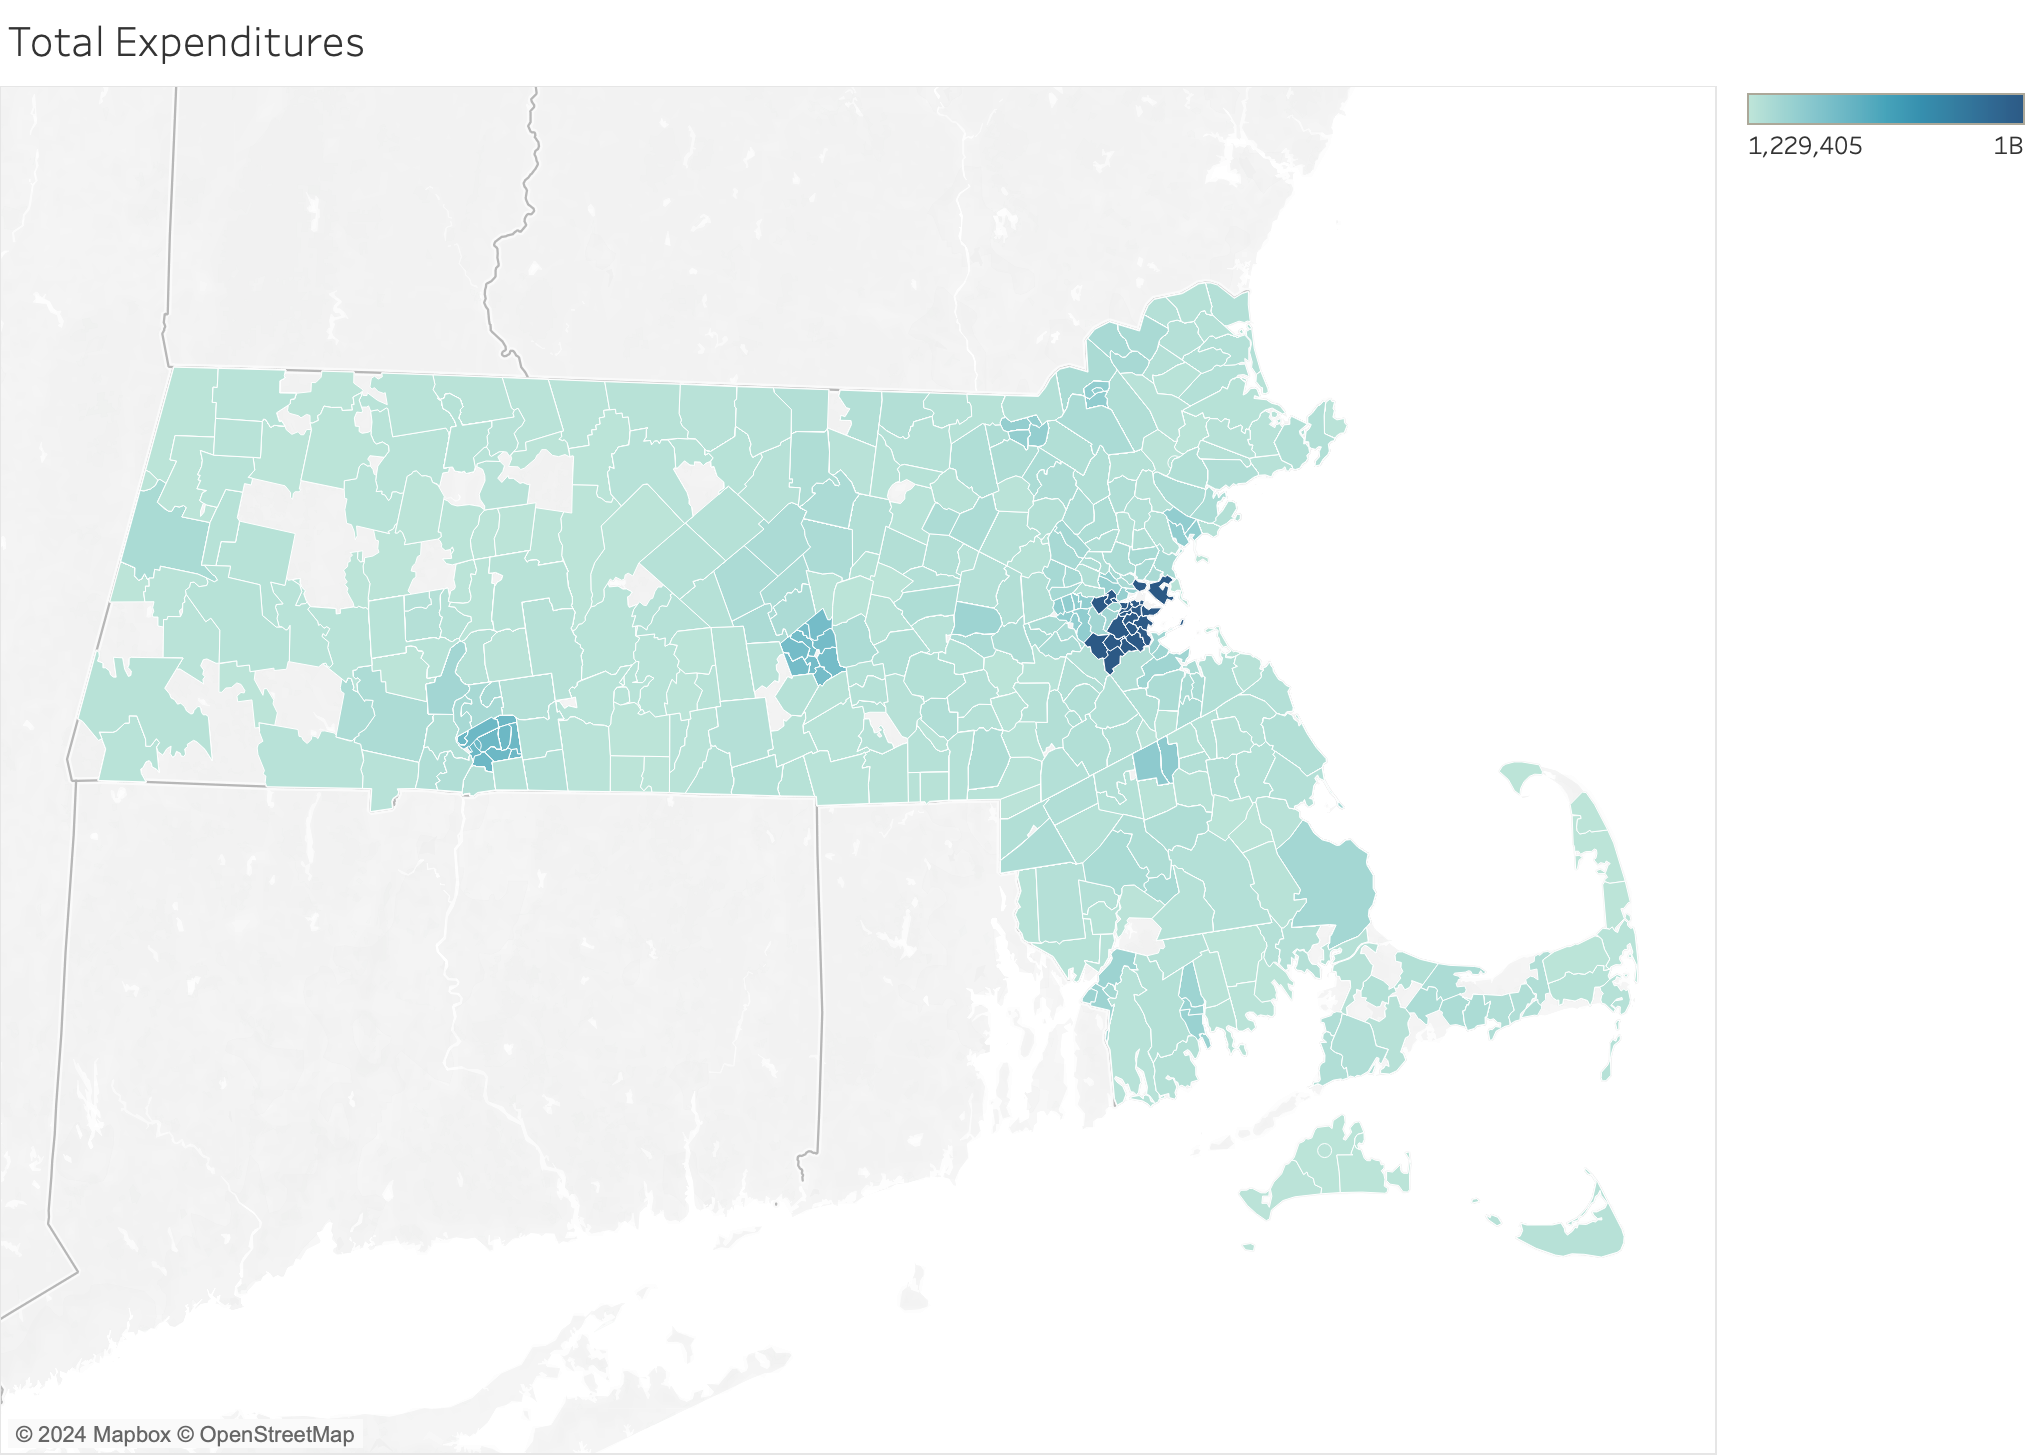
- Average class size, average employee salary, total expenditures, and average number of classes show only weak relationships with graduation, dropout, and college attendance rates. Where correlations exist, they are small and sometimes run counter to common assumptions (for example, slightly higher expenditures associating with lower graduation rates), underscoring the complexity of resource–outcome relationships.
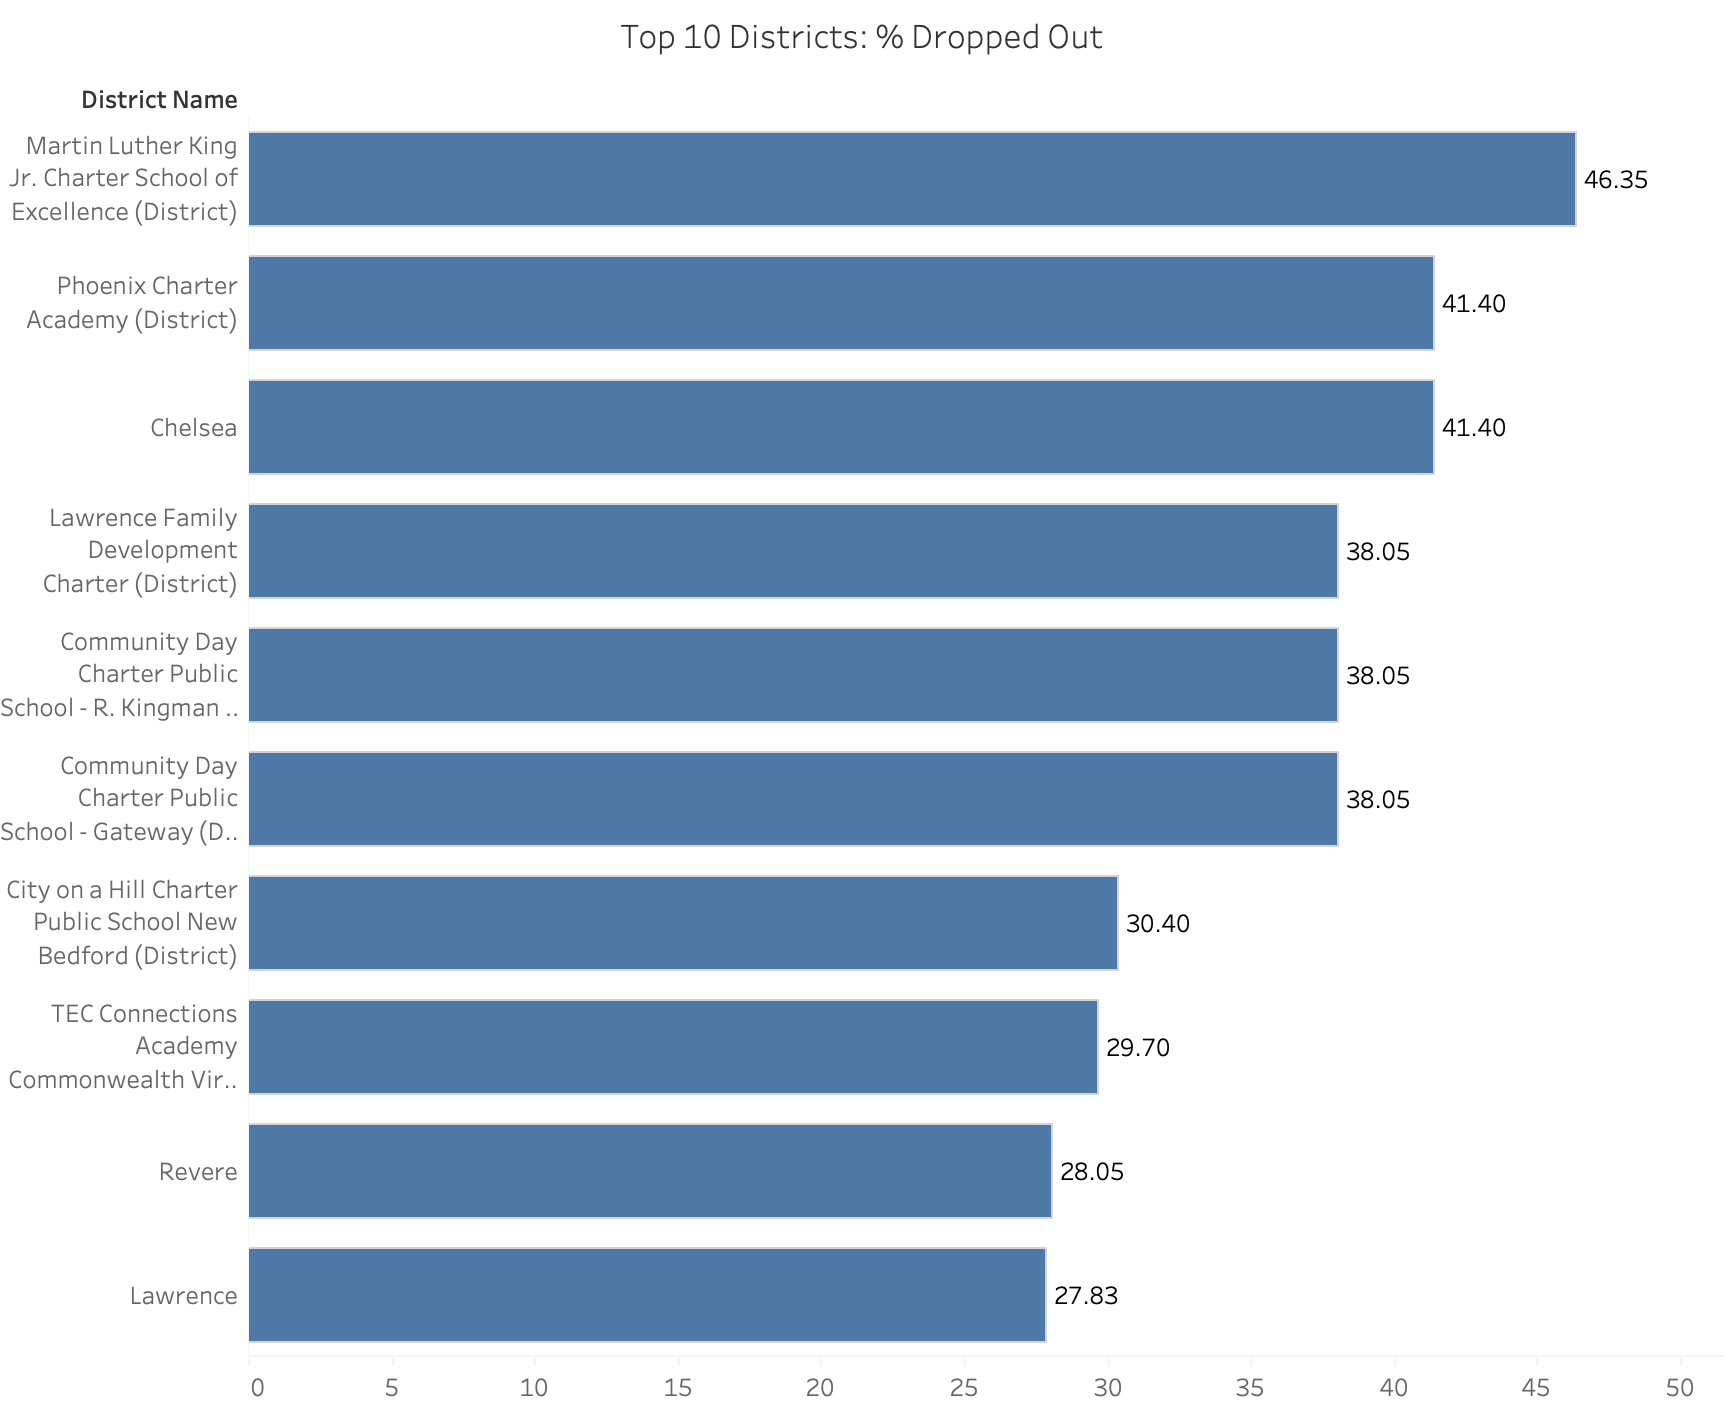
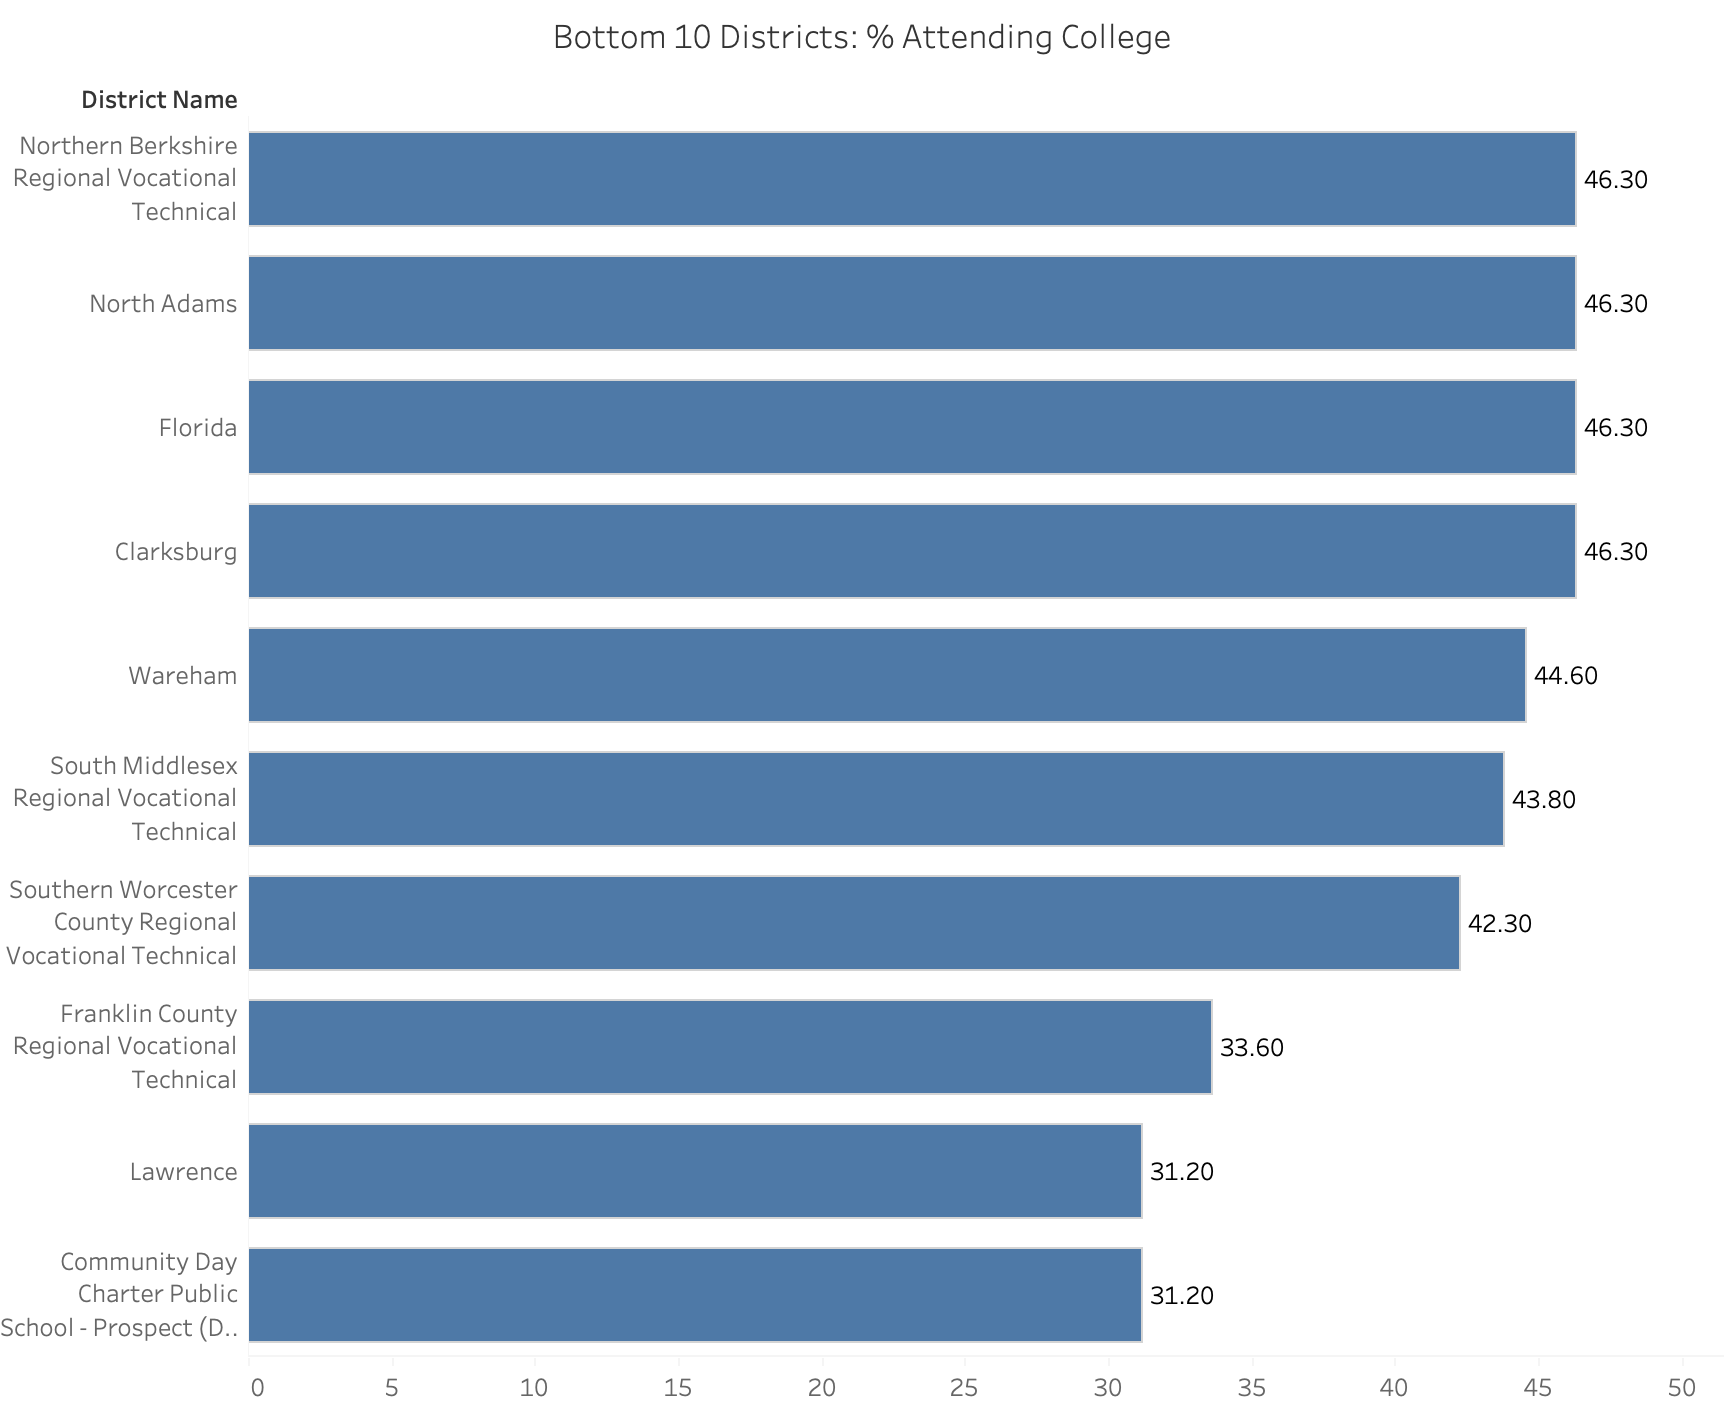
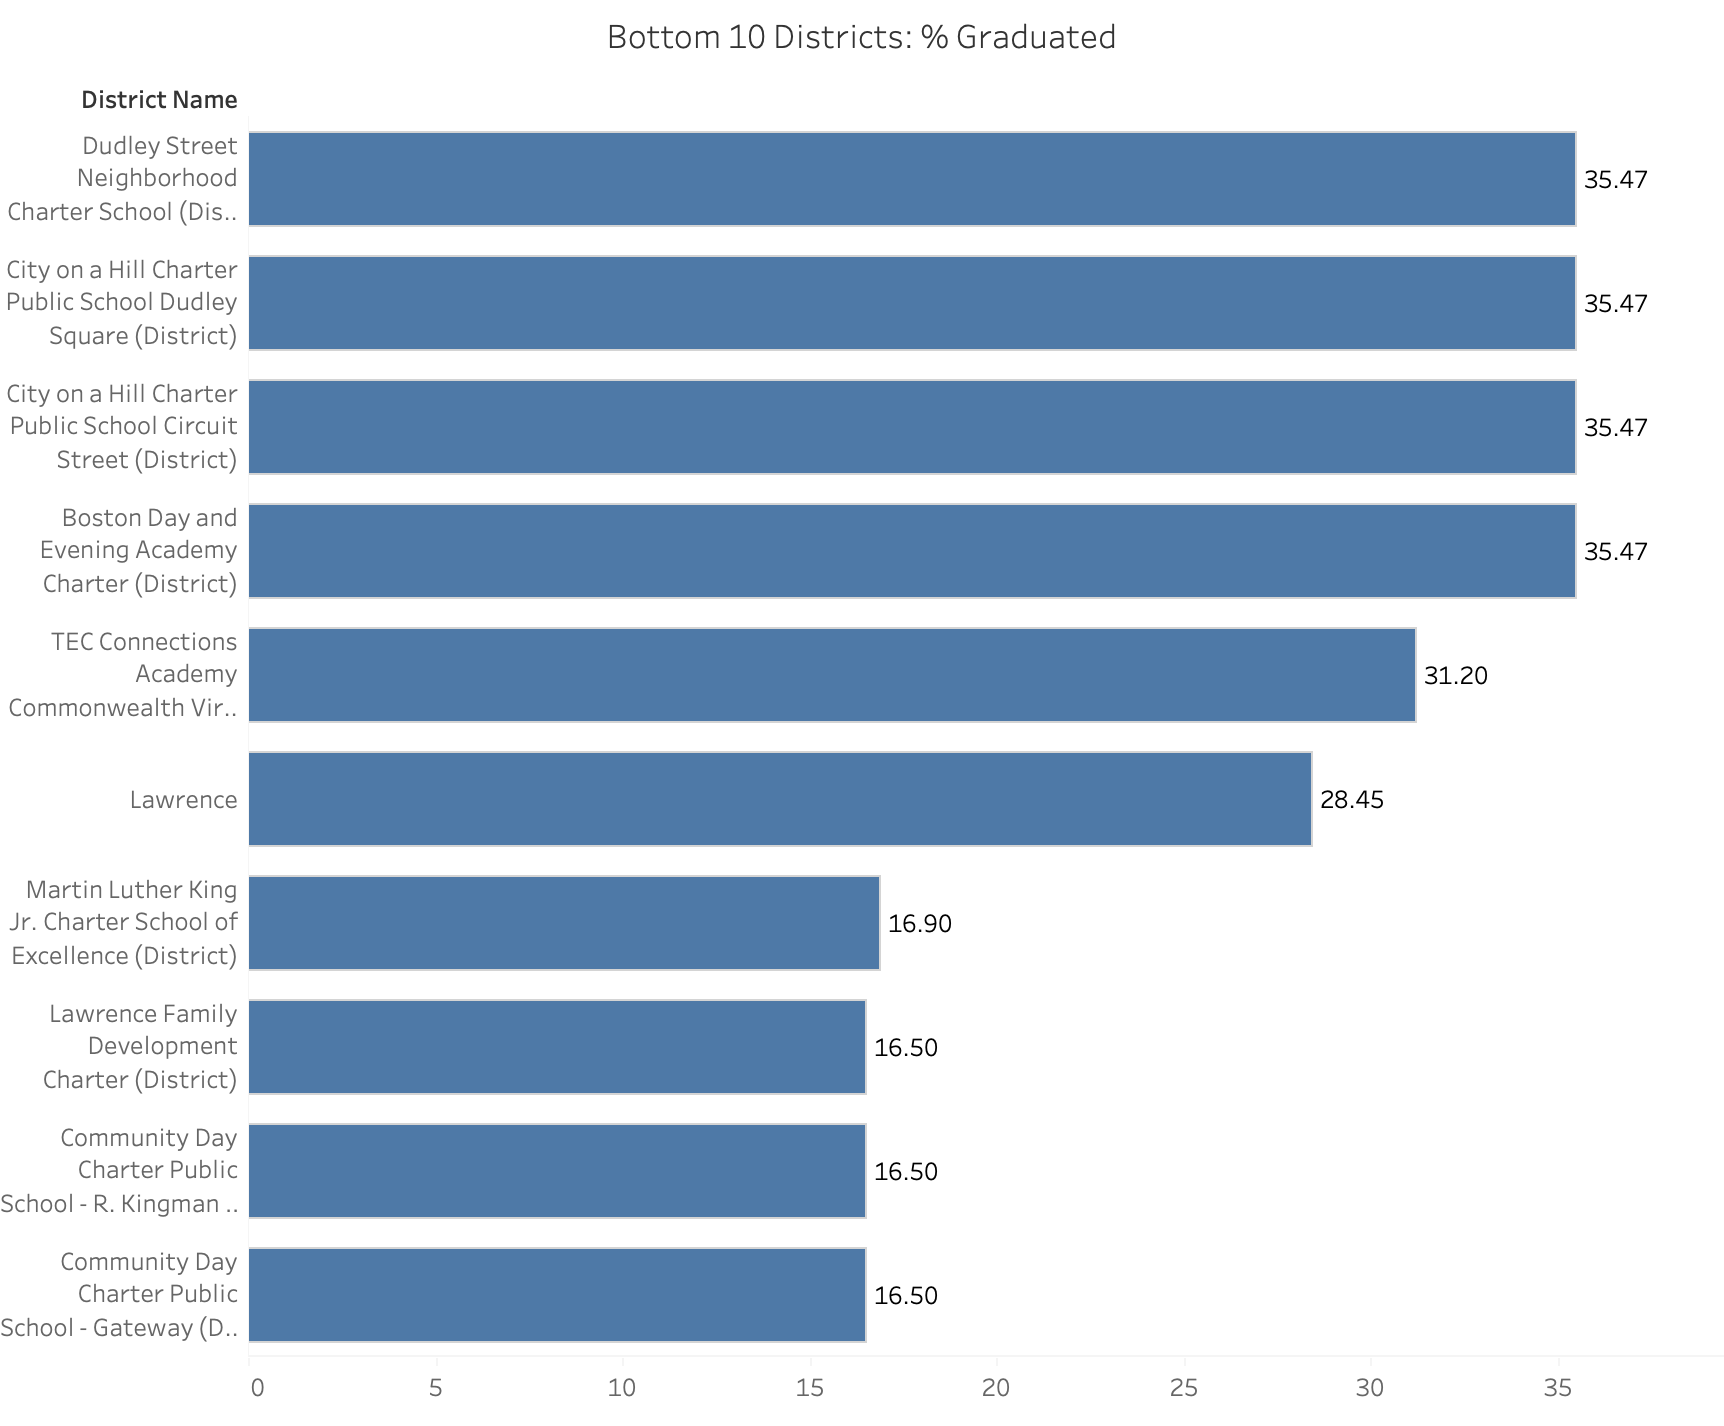
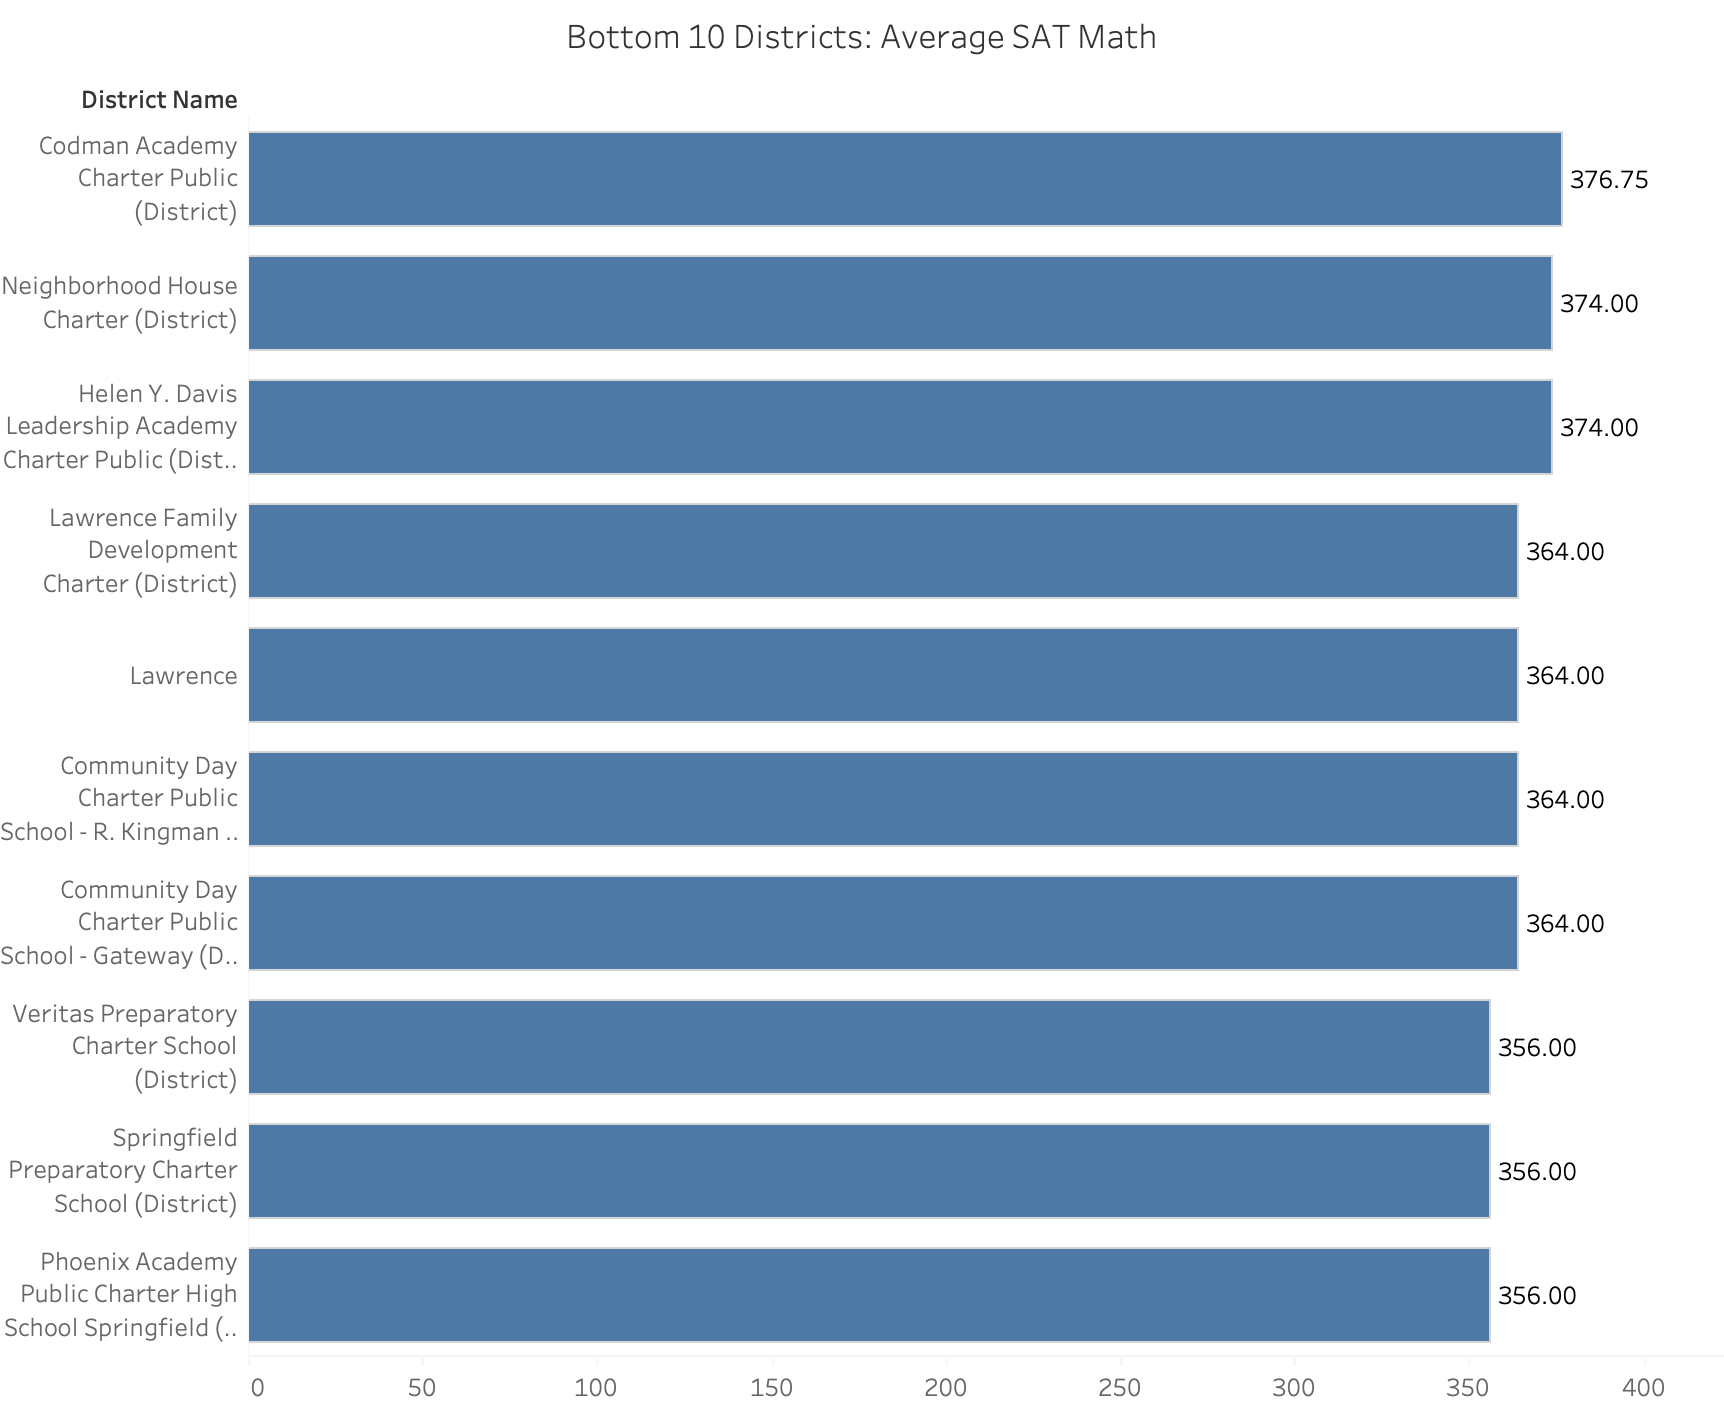
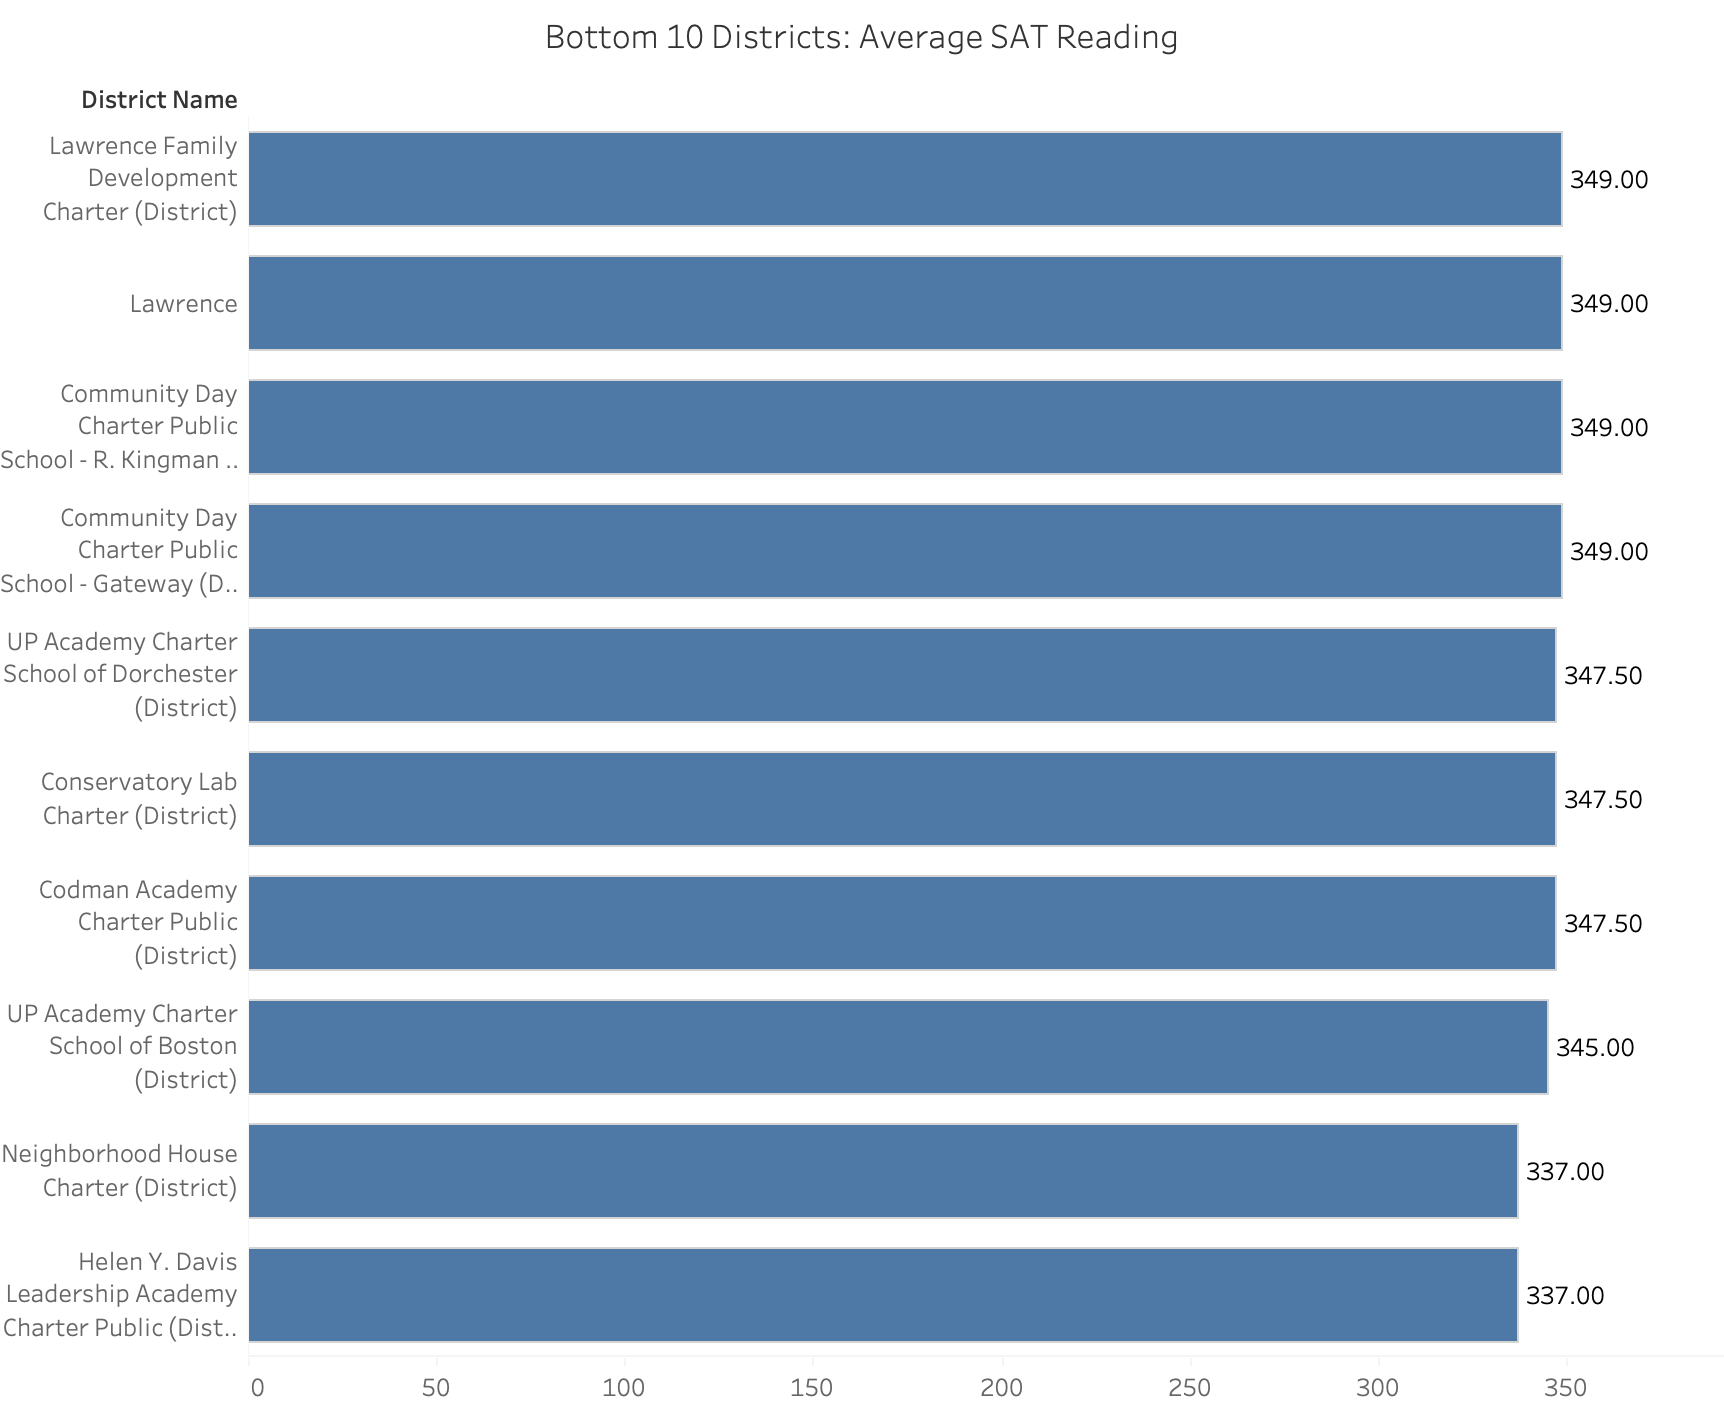
- Districts such as Lawrence, Chelsea, Springfield, Lowell, and Revere exhibit some of the lowest graduation and college attendance rates, higher dropout rates, and weaker test performance. These districts also have larger shares of Hispanic and economically disadvantaged students, highlighting localized concentrations of educational disadvantage within the state.
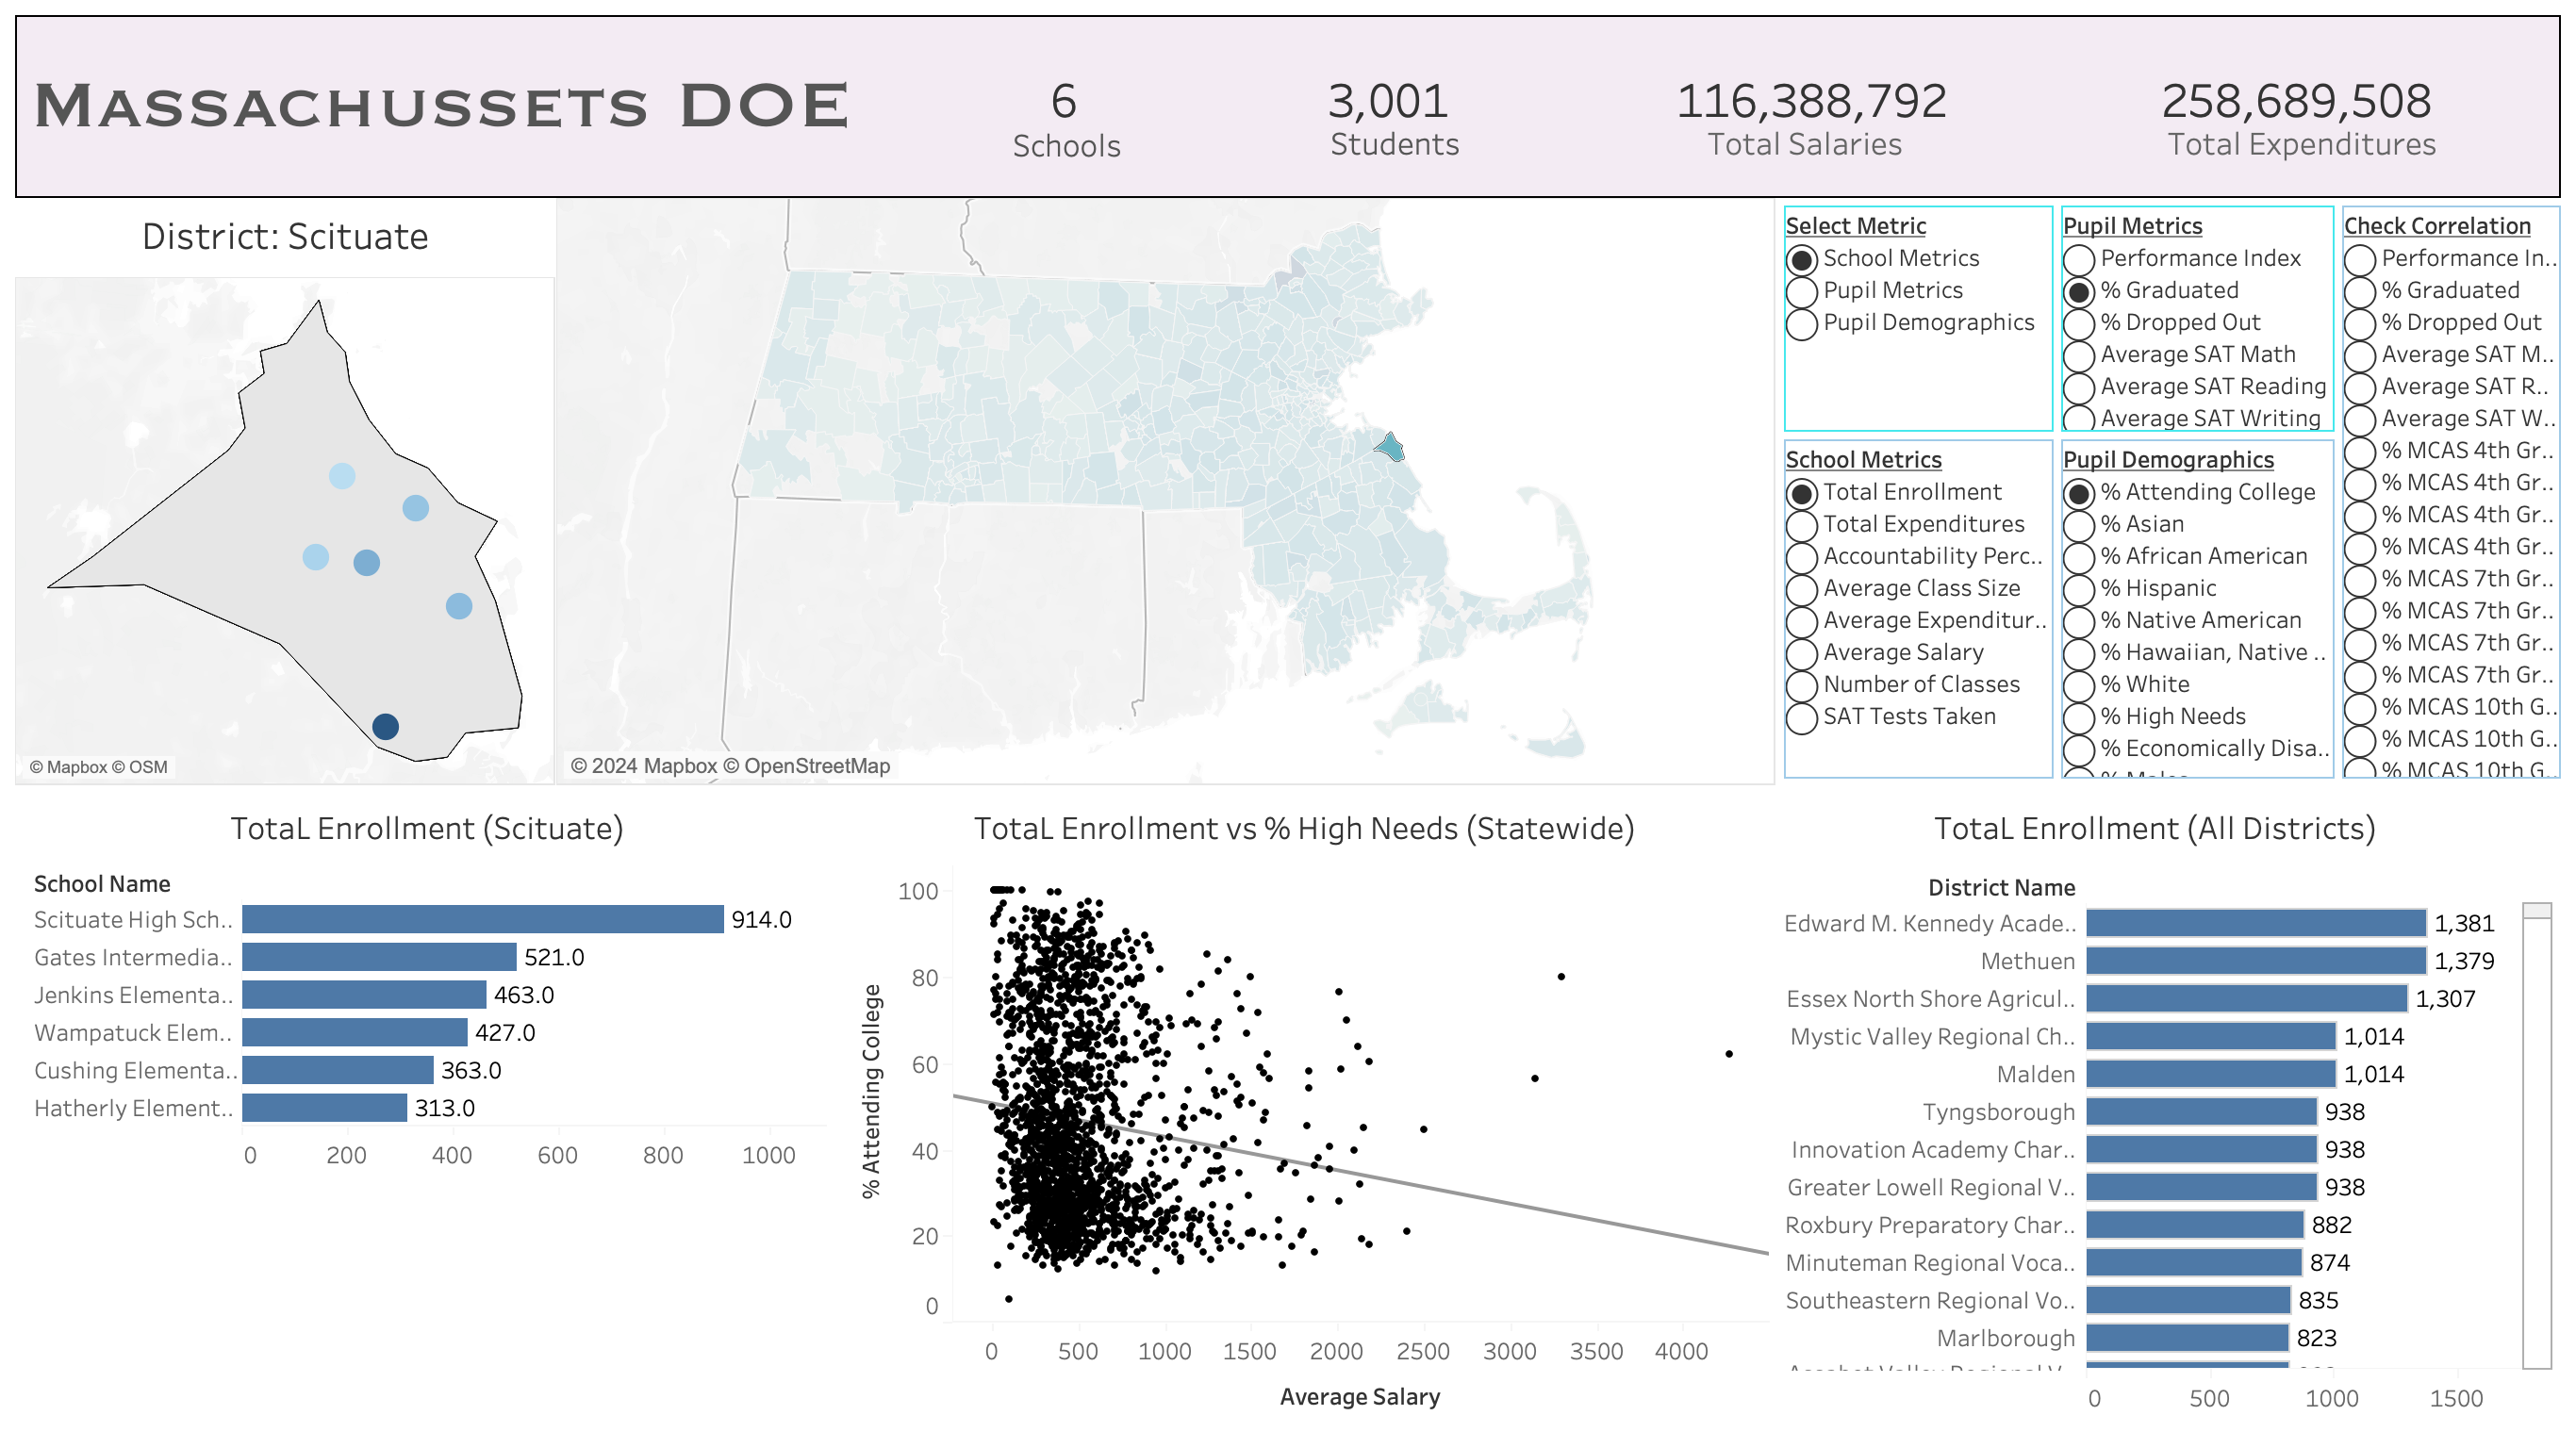
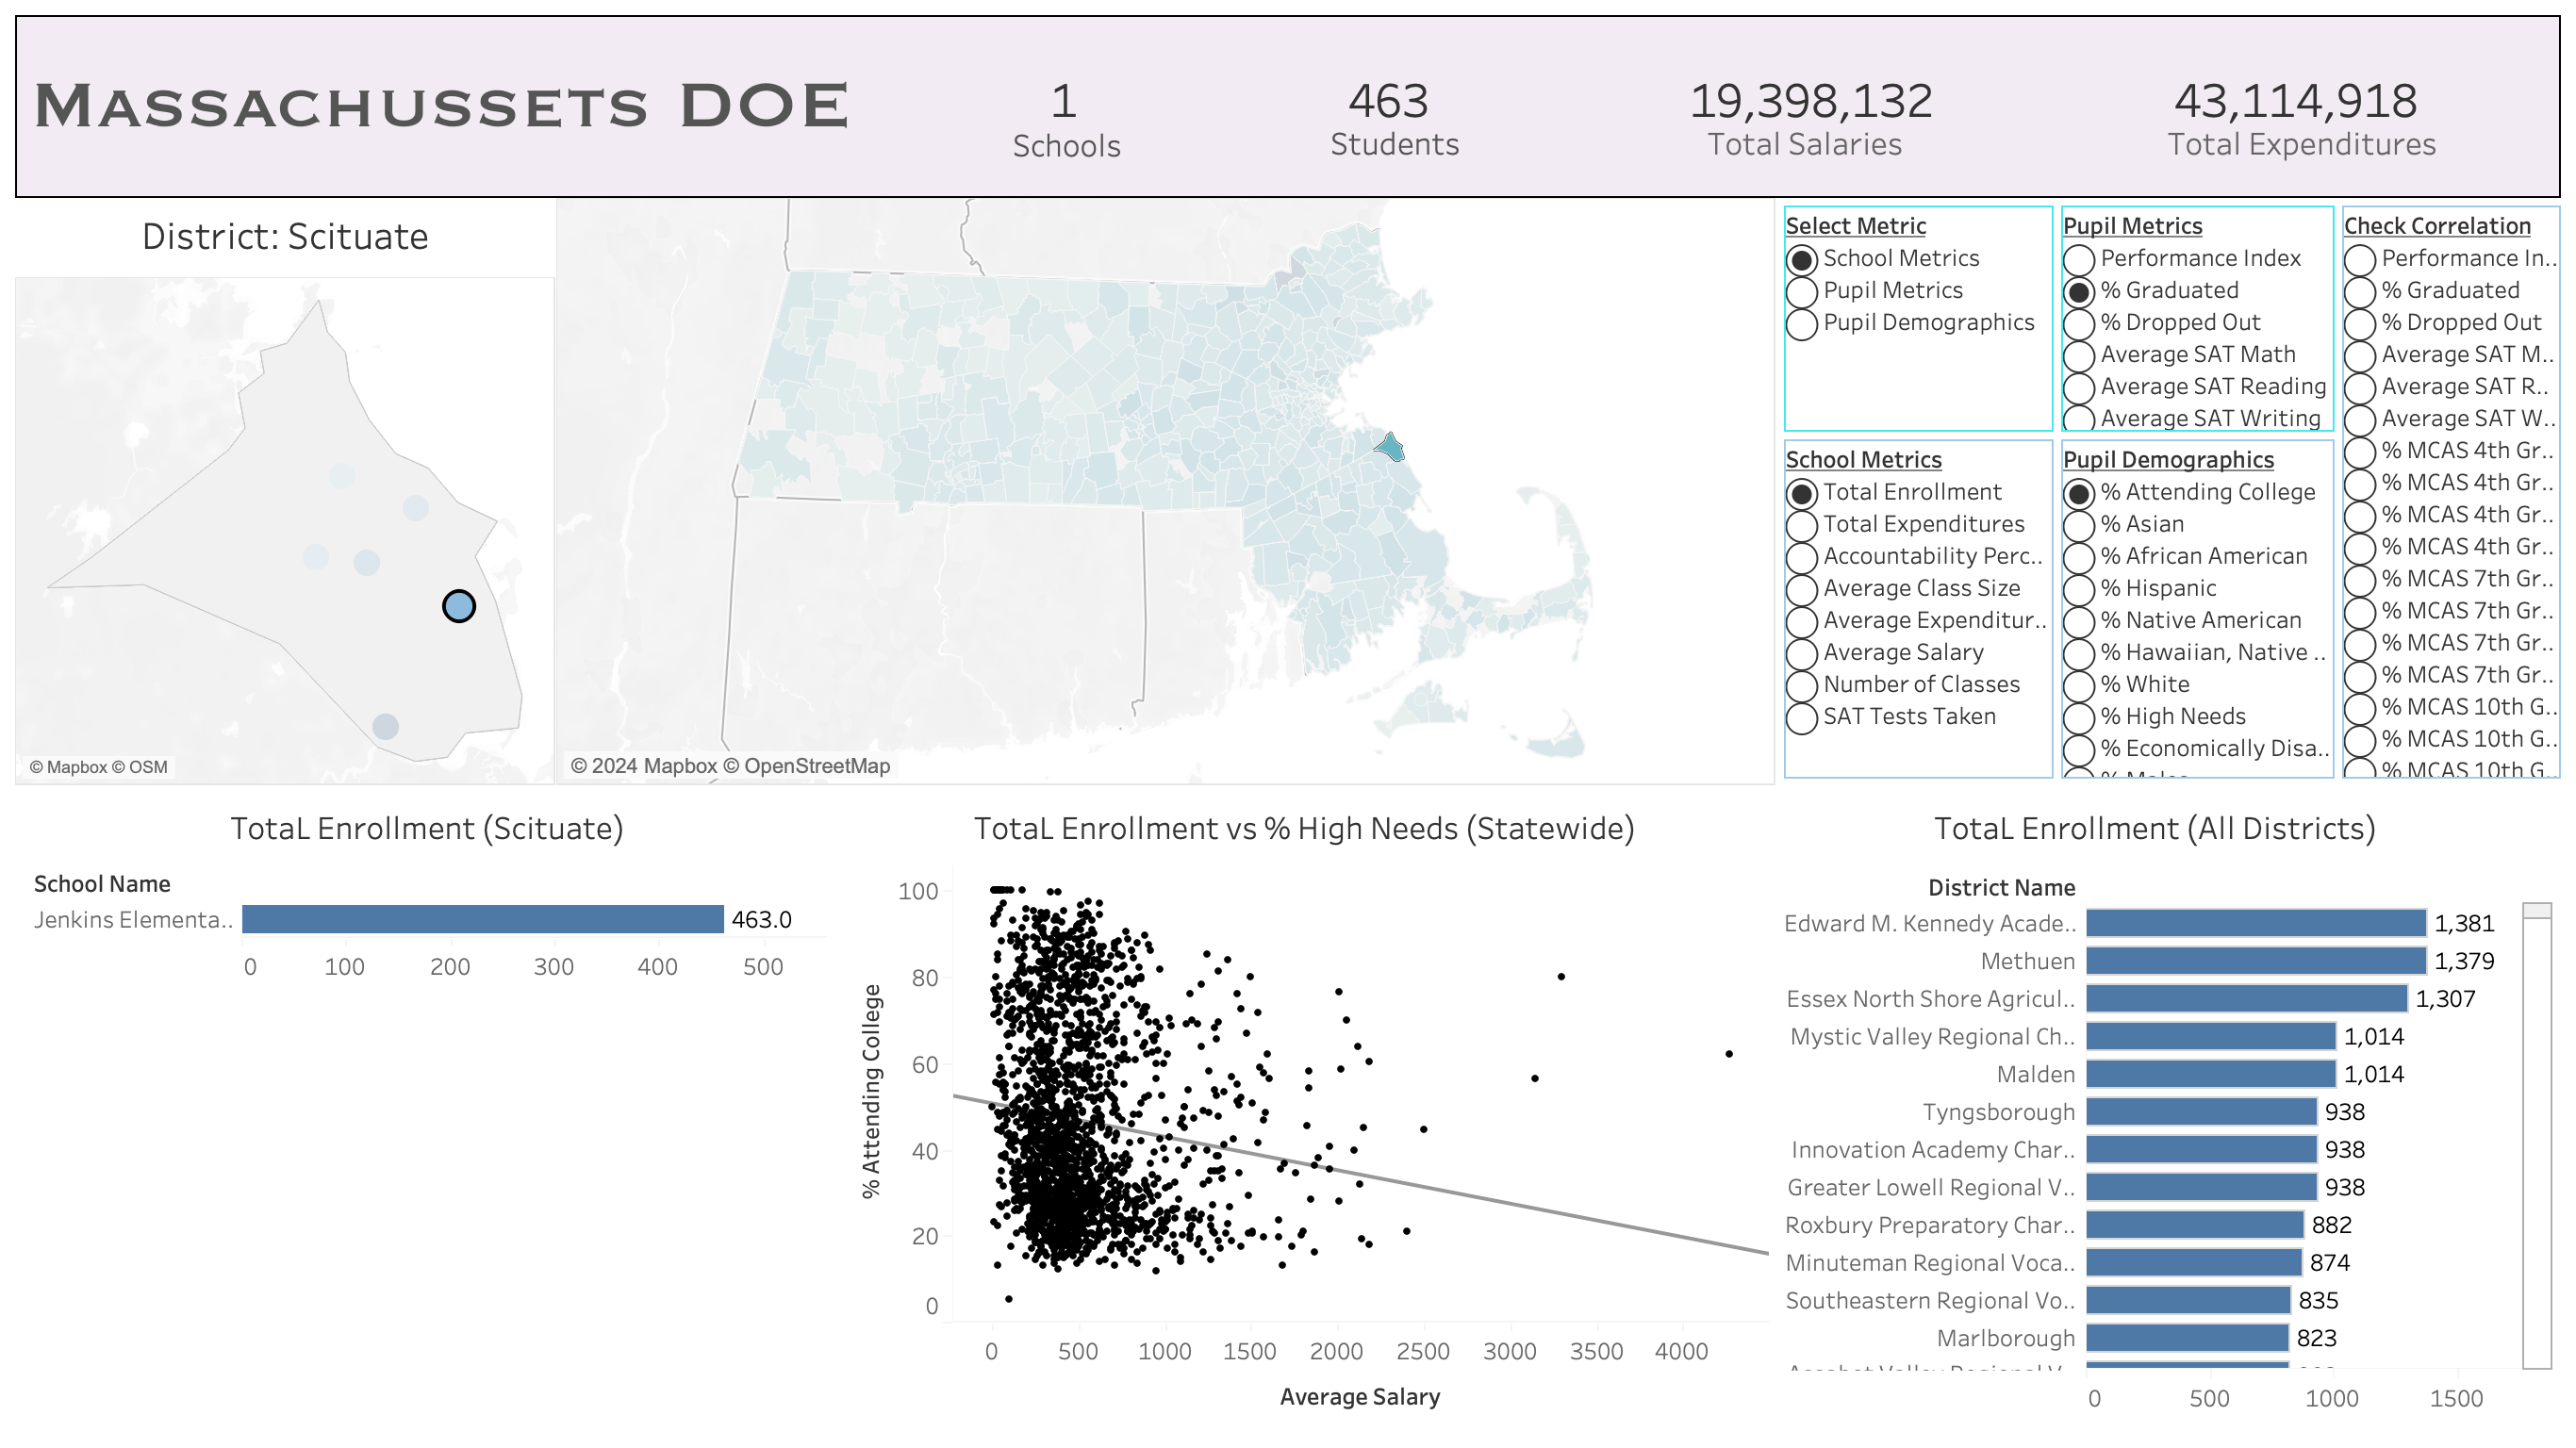
Dashboard
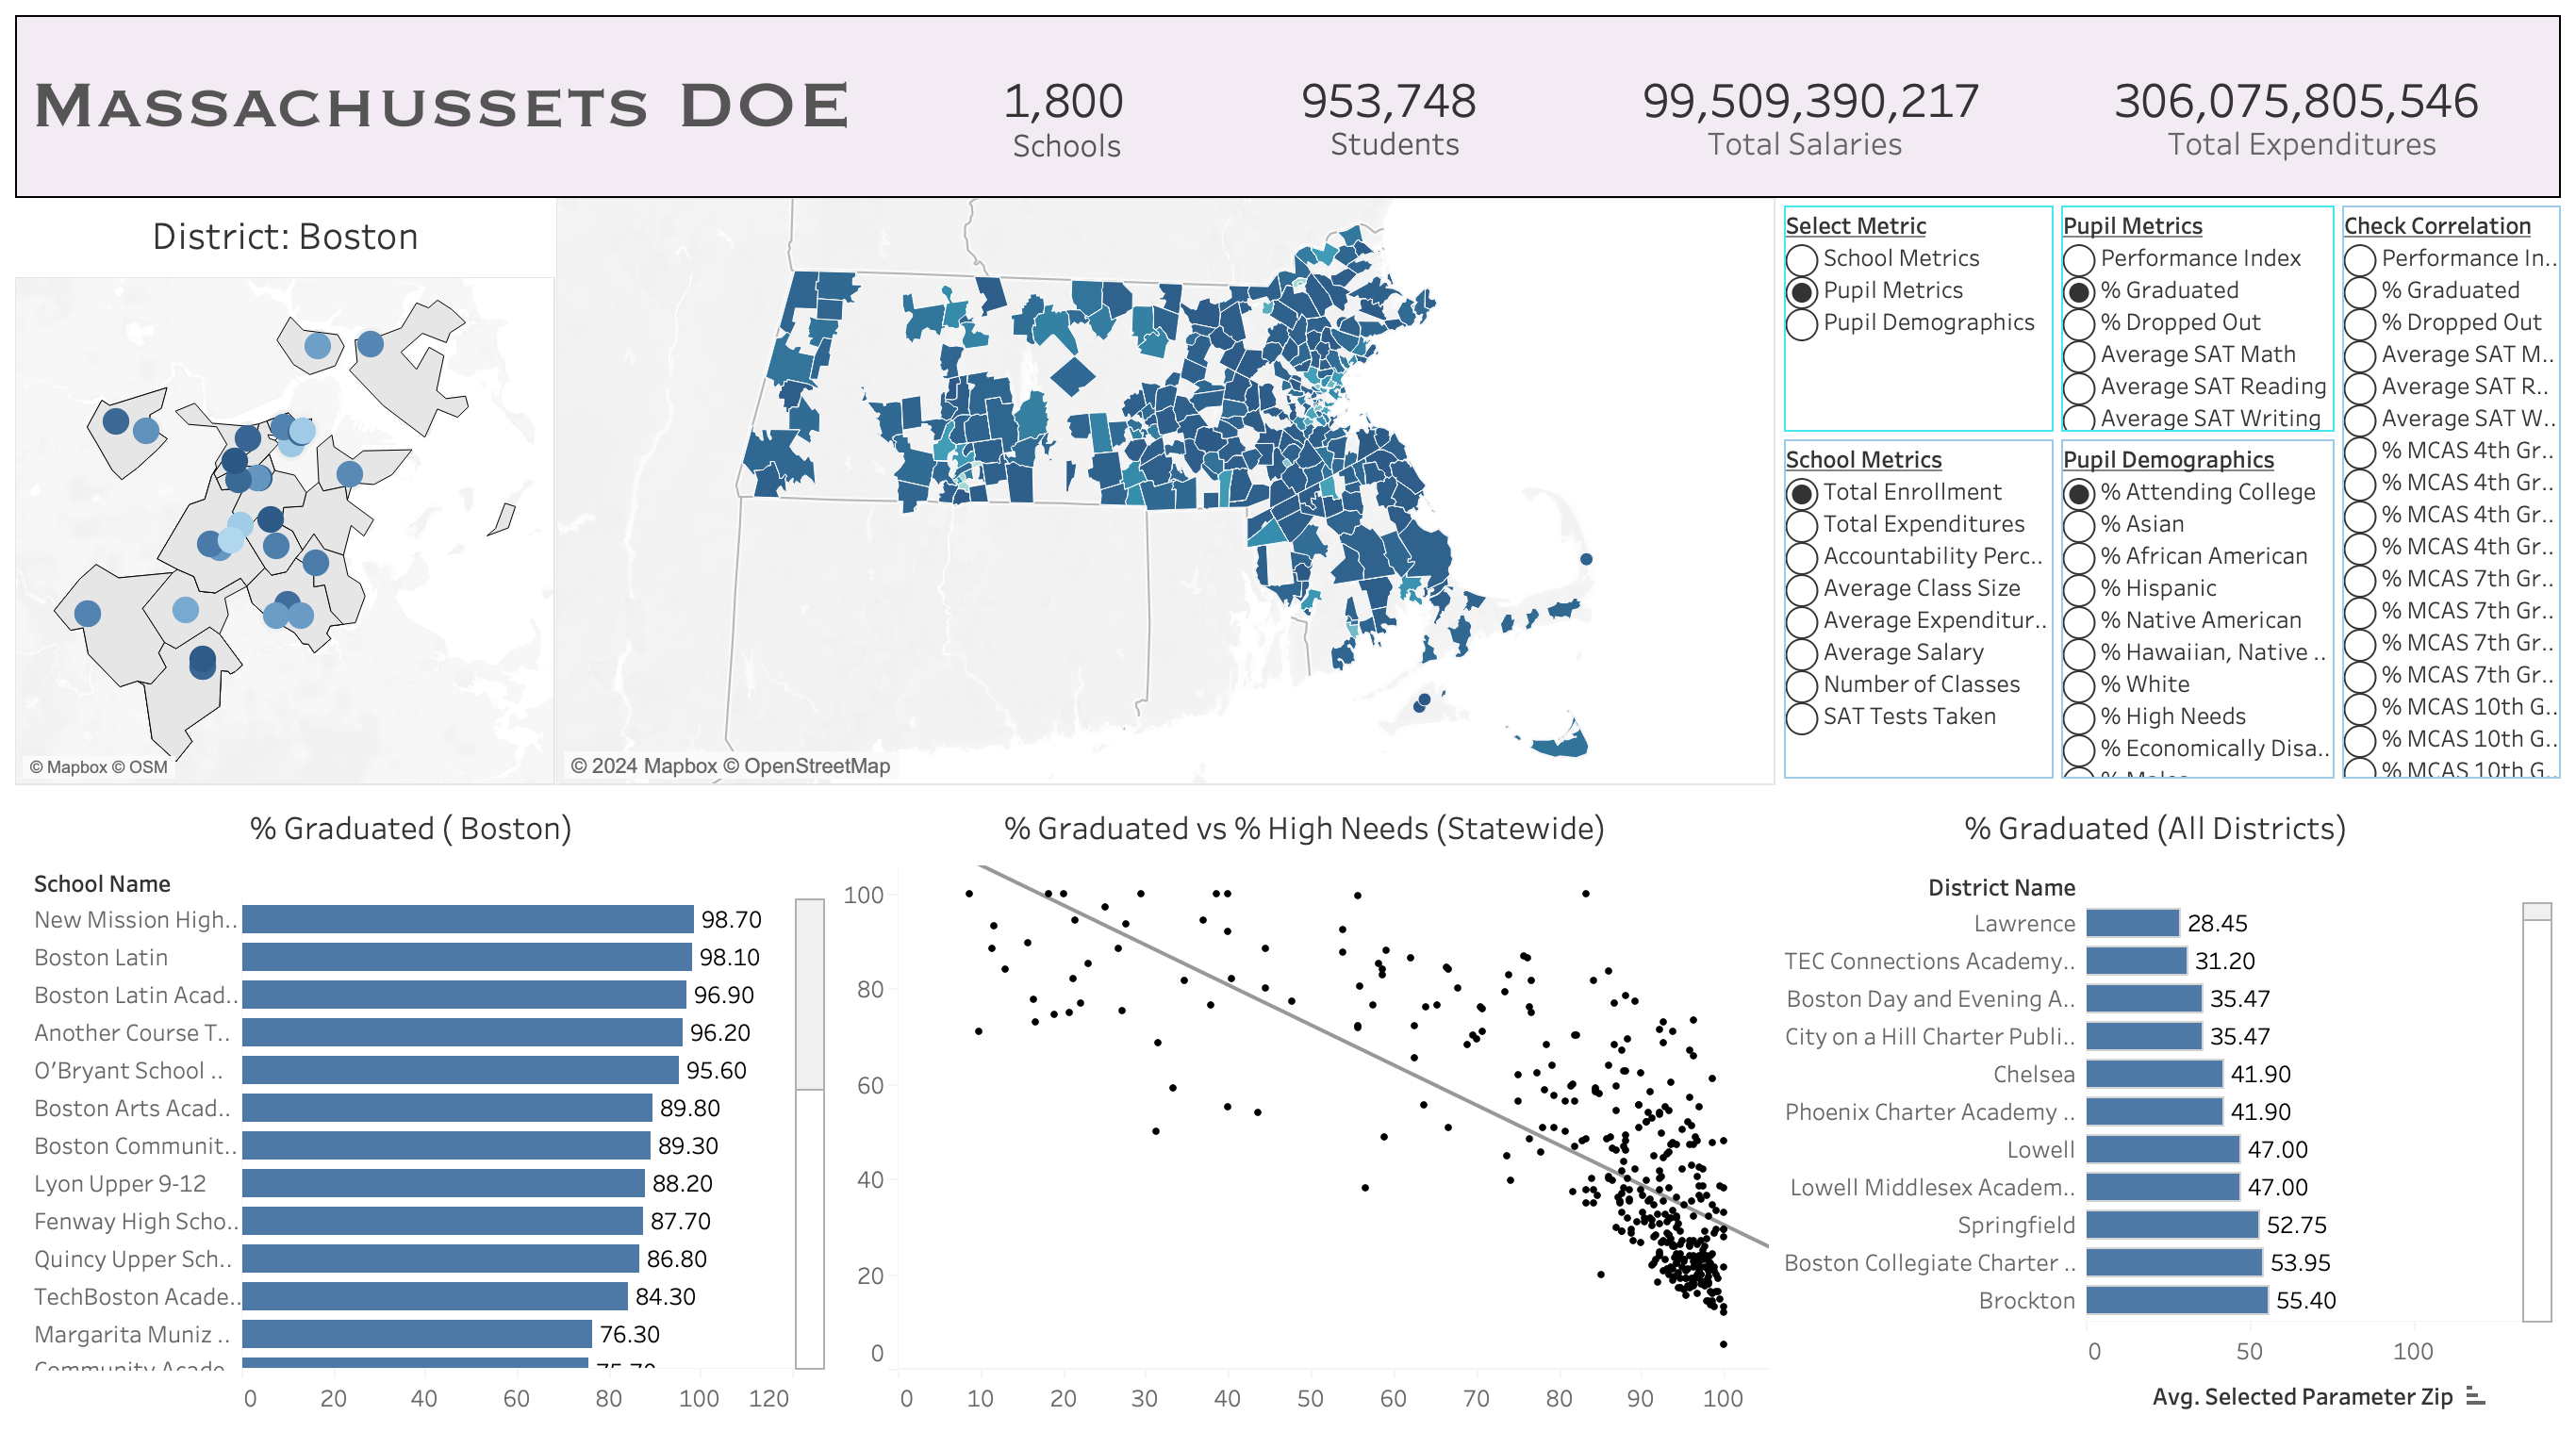
Visualizing Notable Trends: A Socioeconomic Achievement Gap
Visualizing Notable Trends: A Gender Achievement Gap
Visualizing Notable Trends: Average class size, Average Employee Salaries, and Total Expenditures (Lack of an Effect)
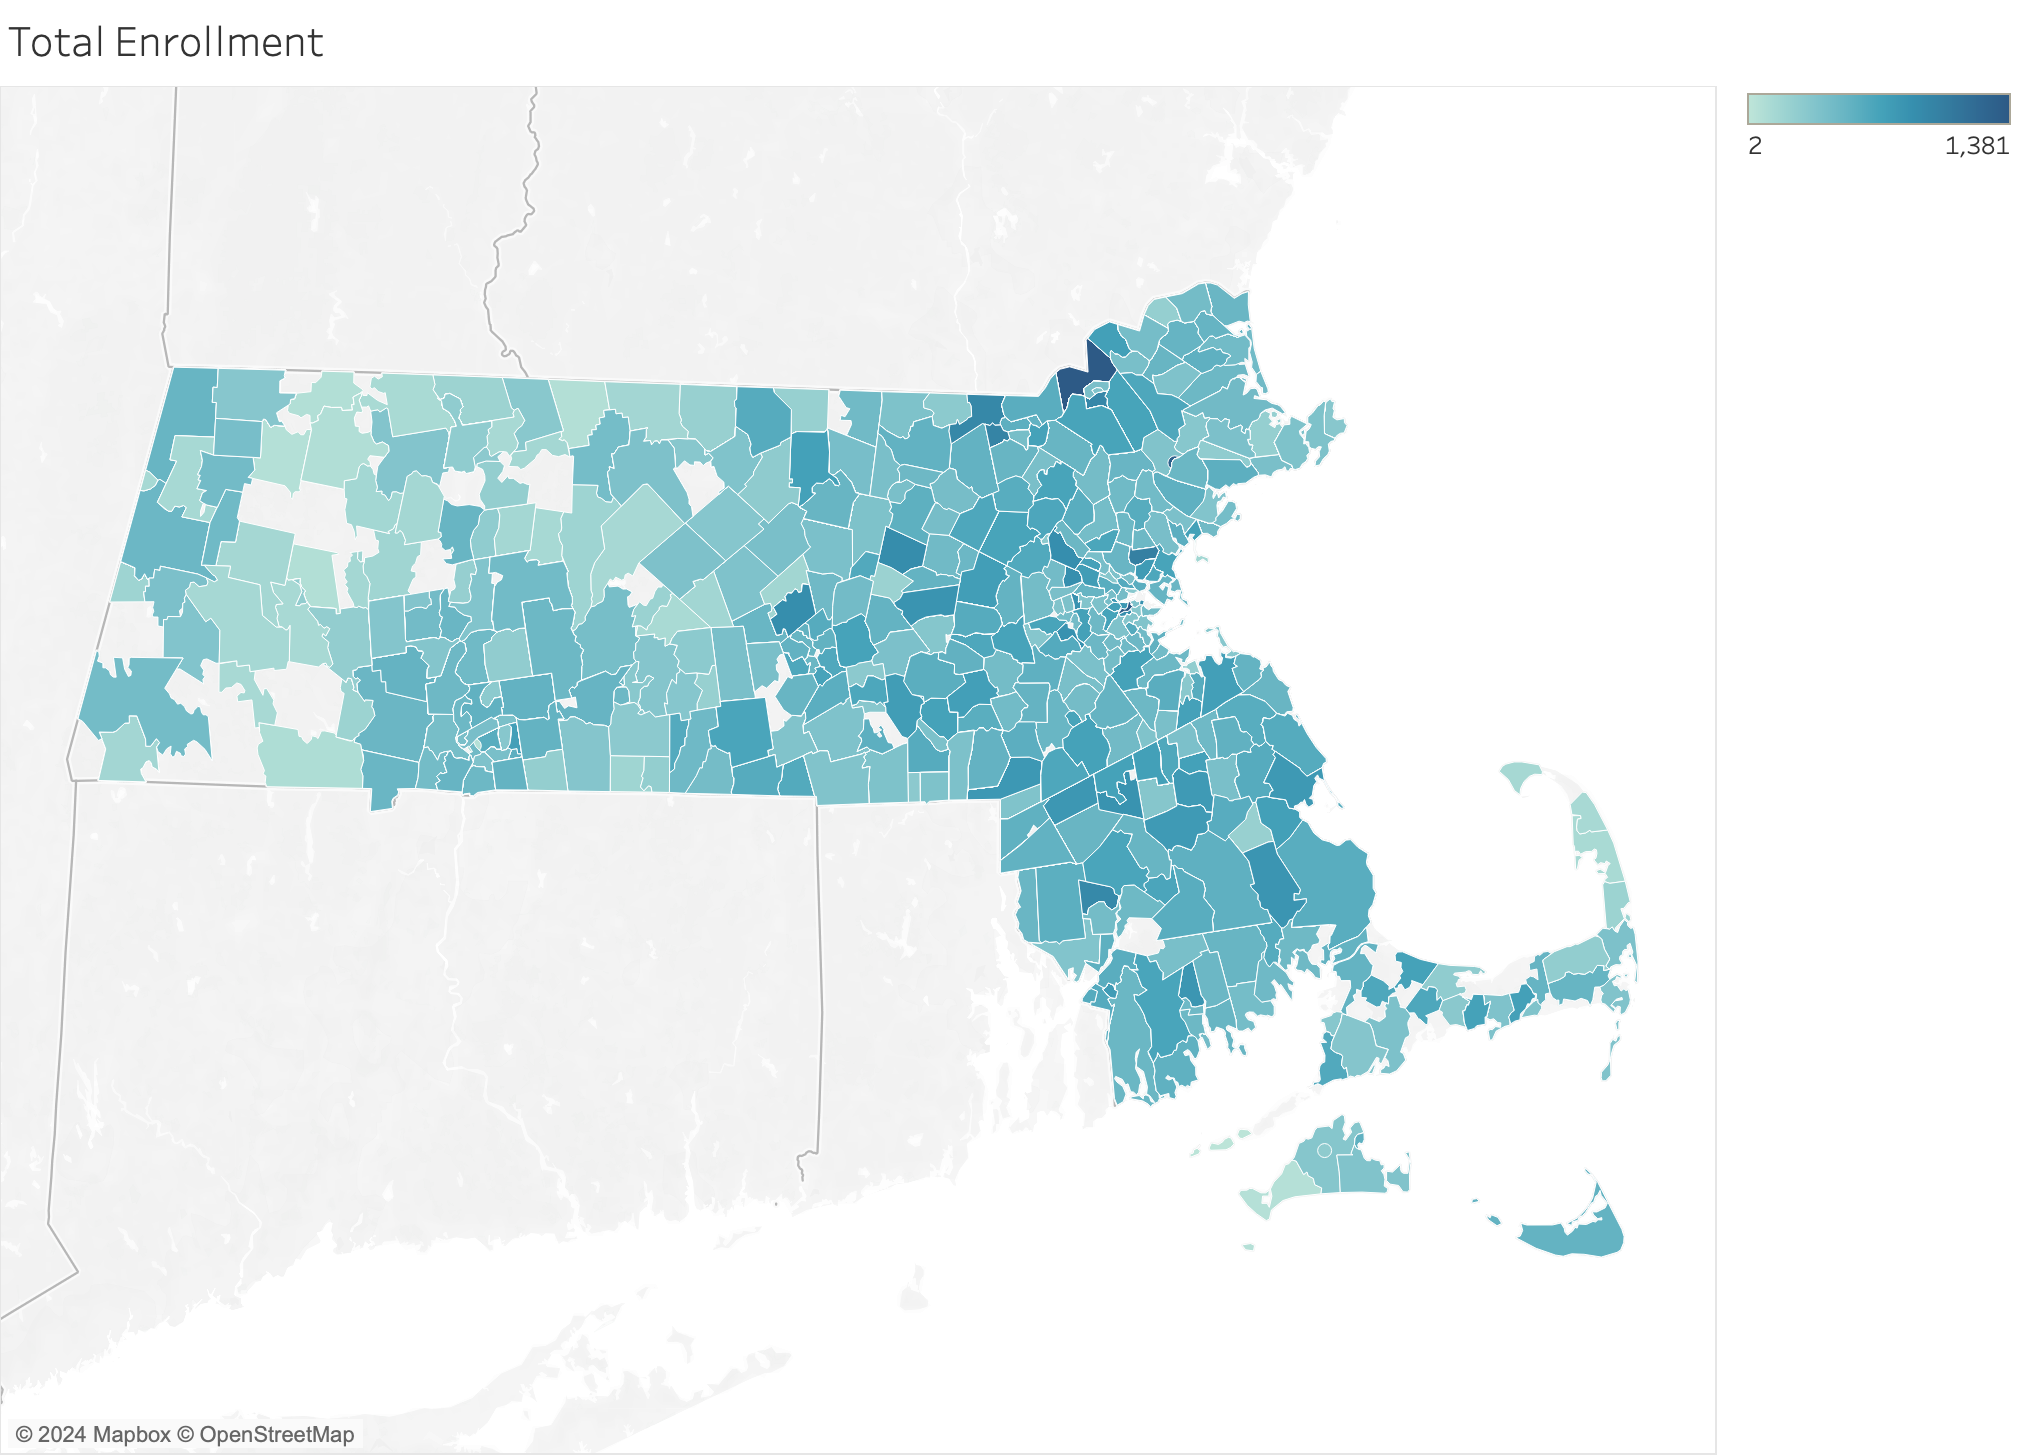
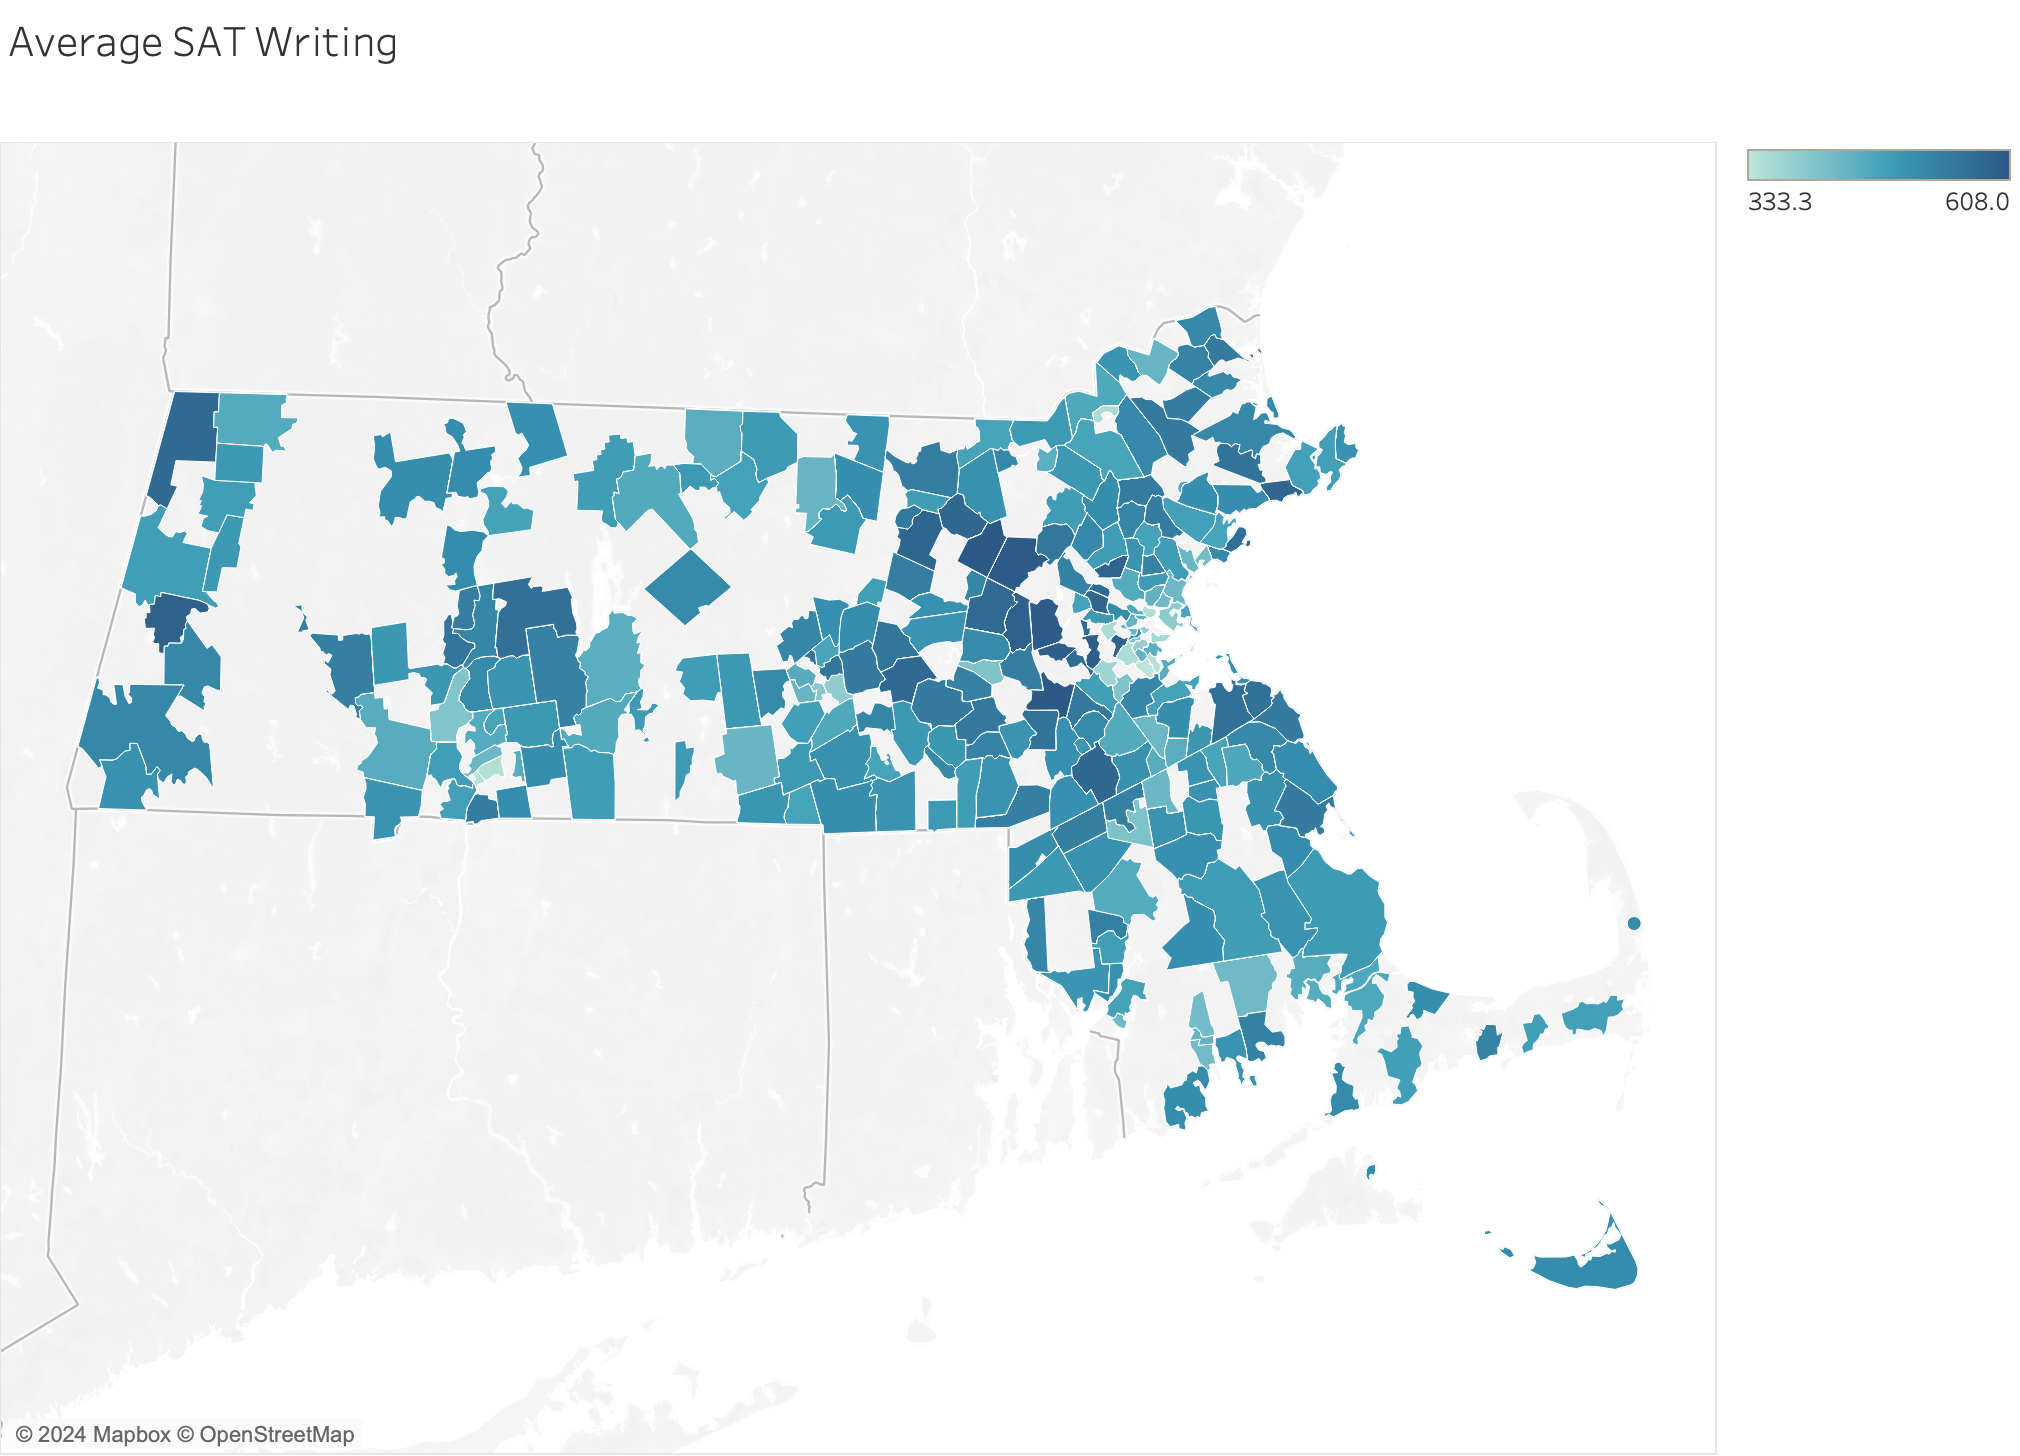
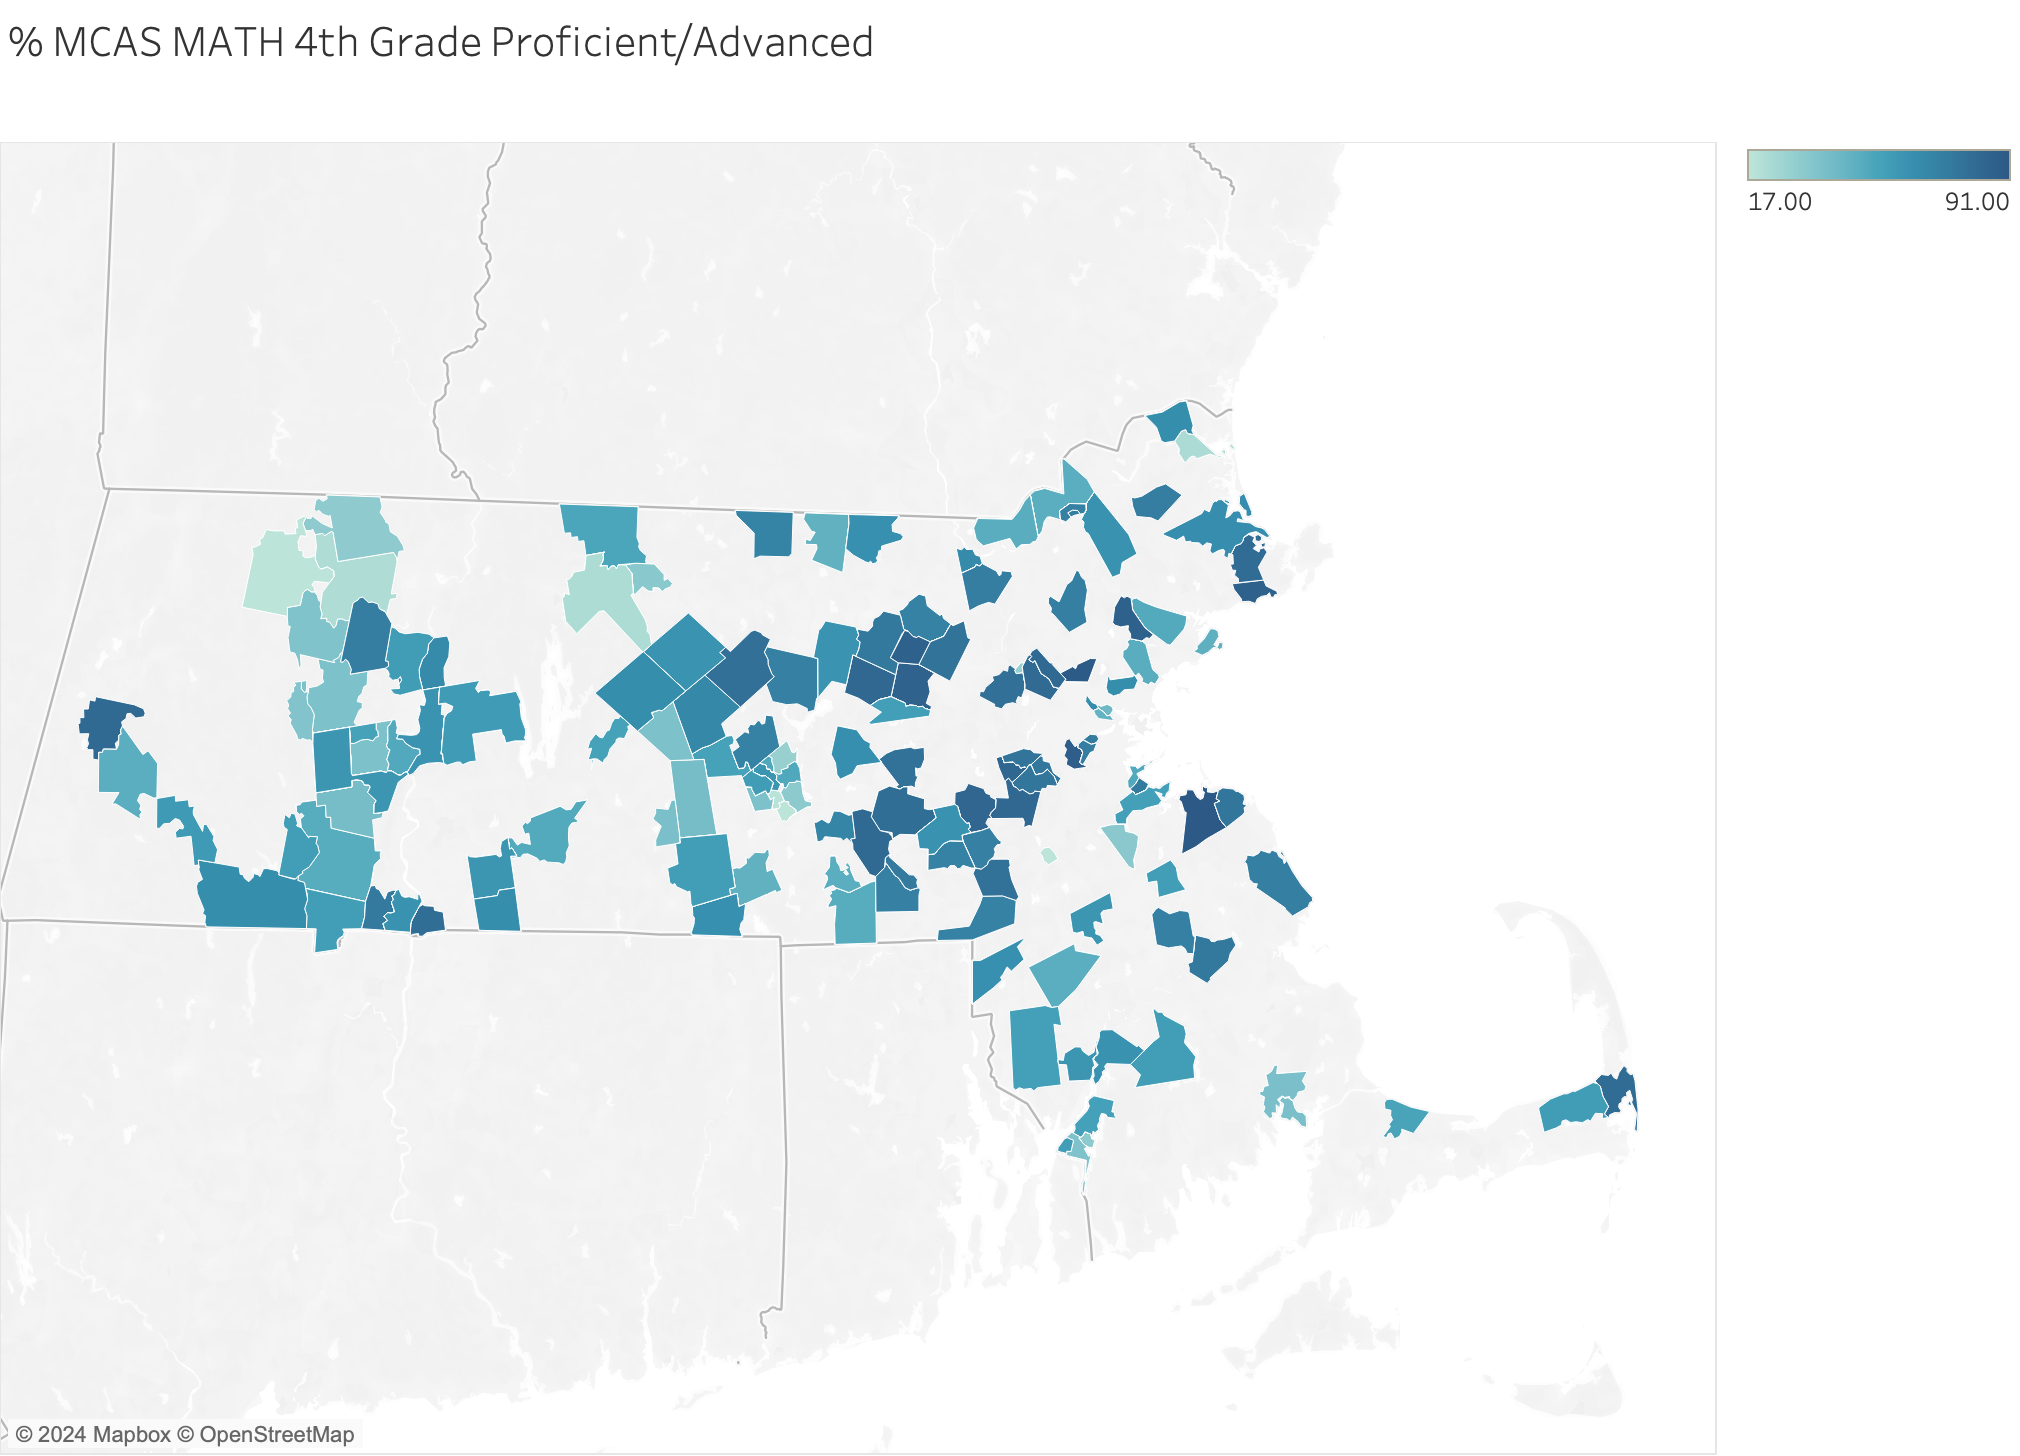
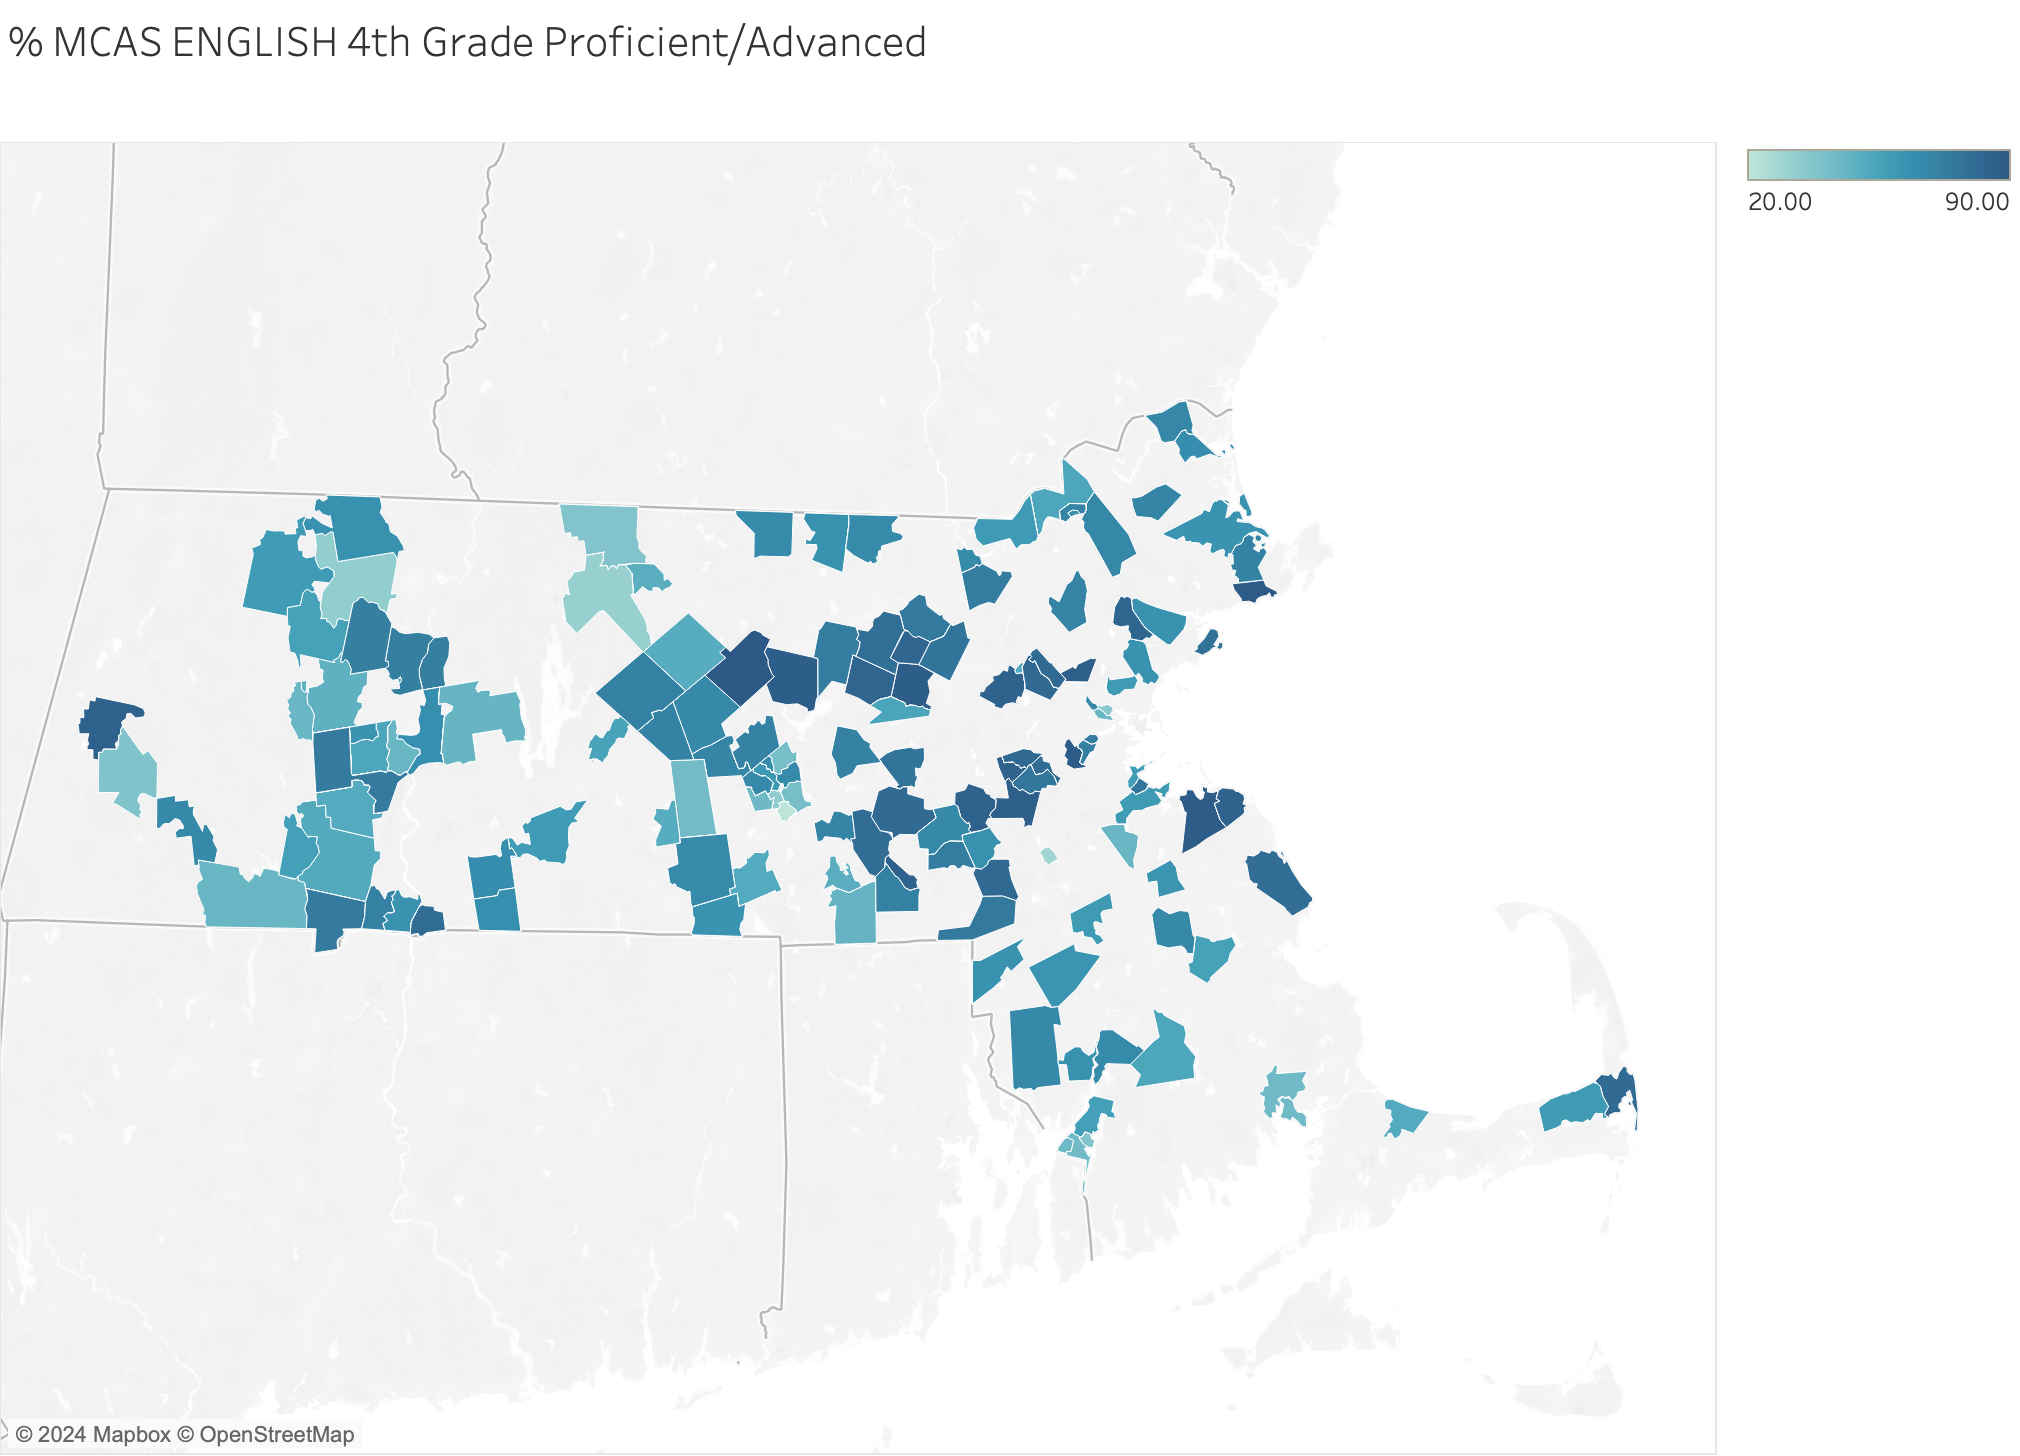
Visualizing Metric Distribution


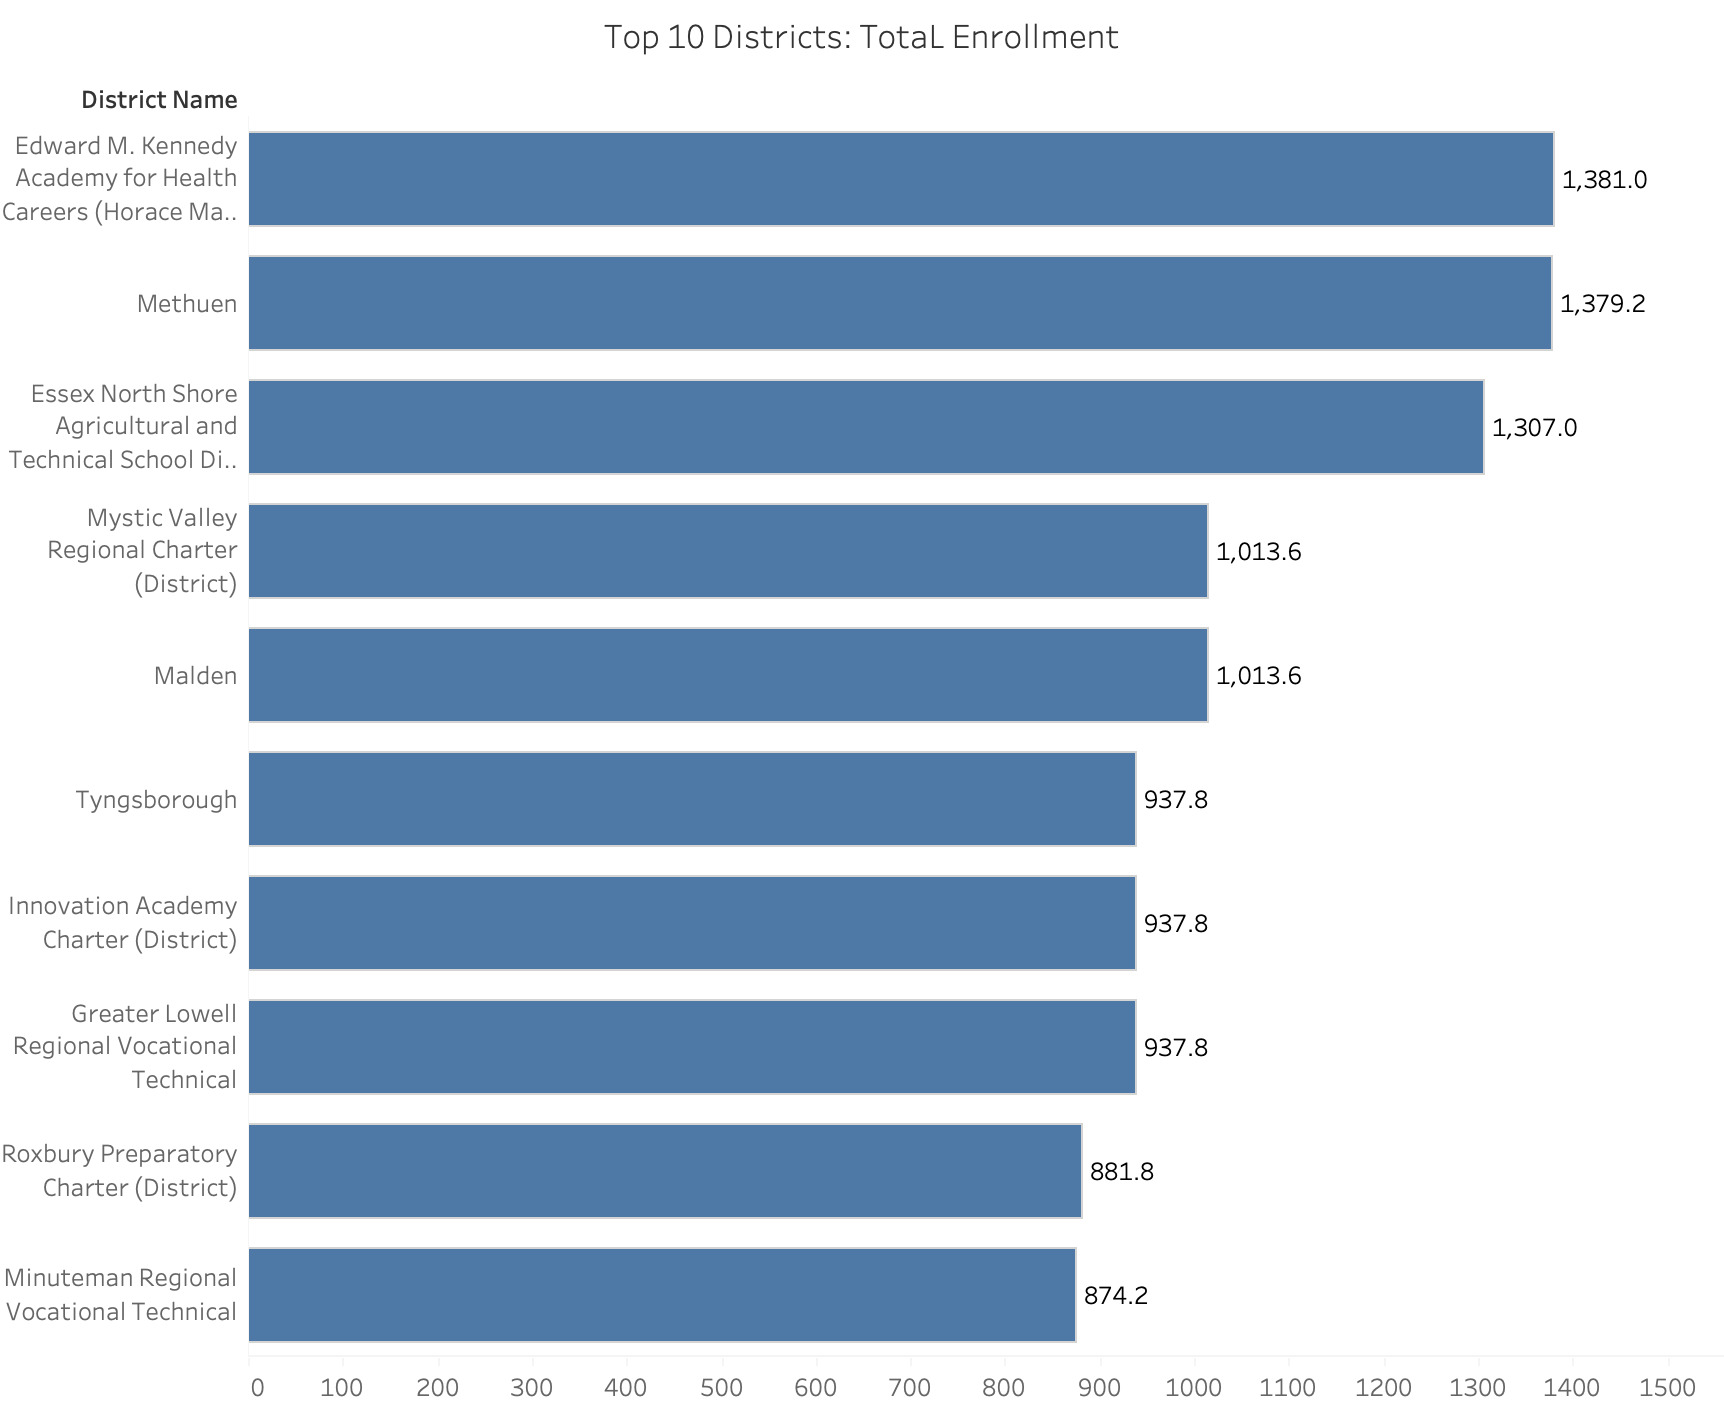
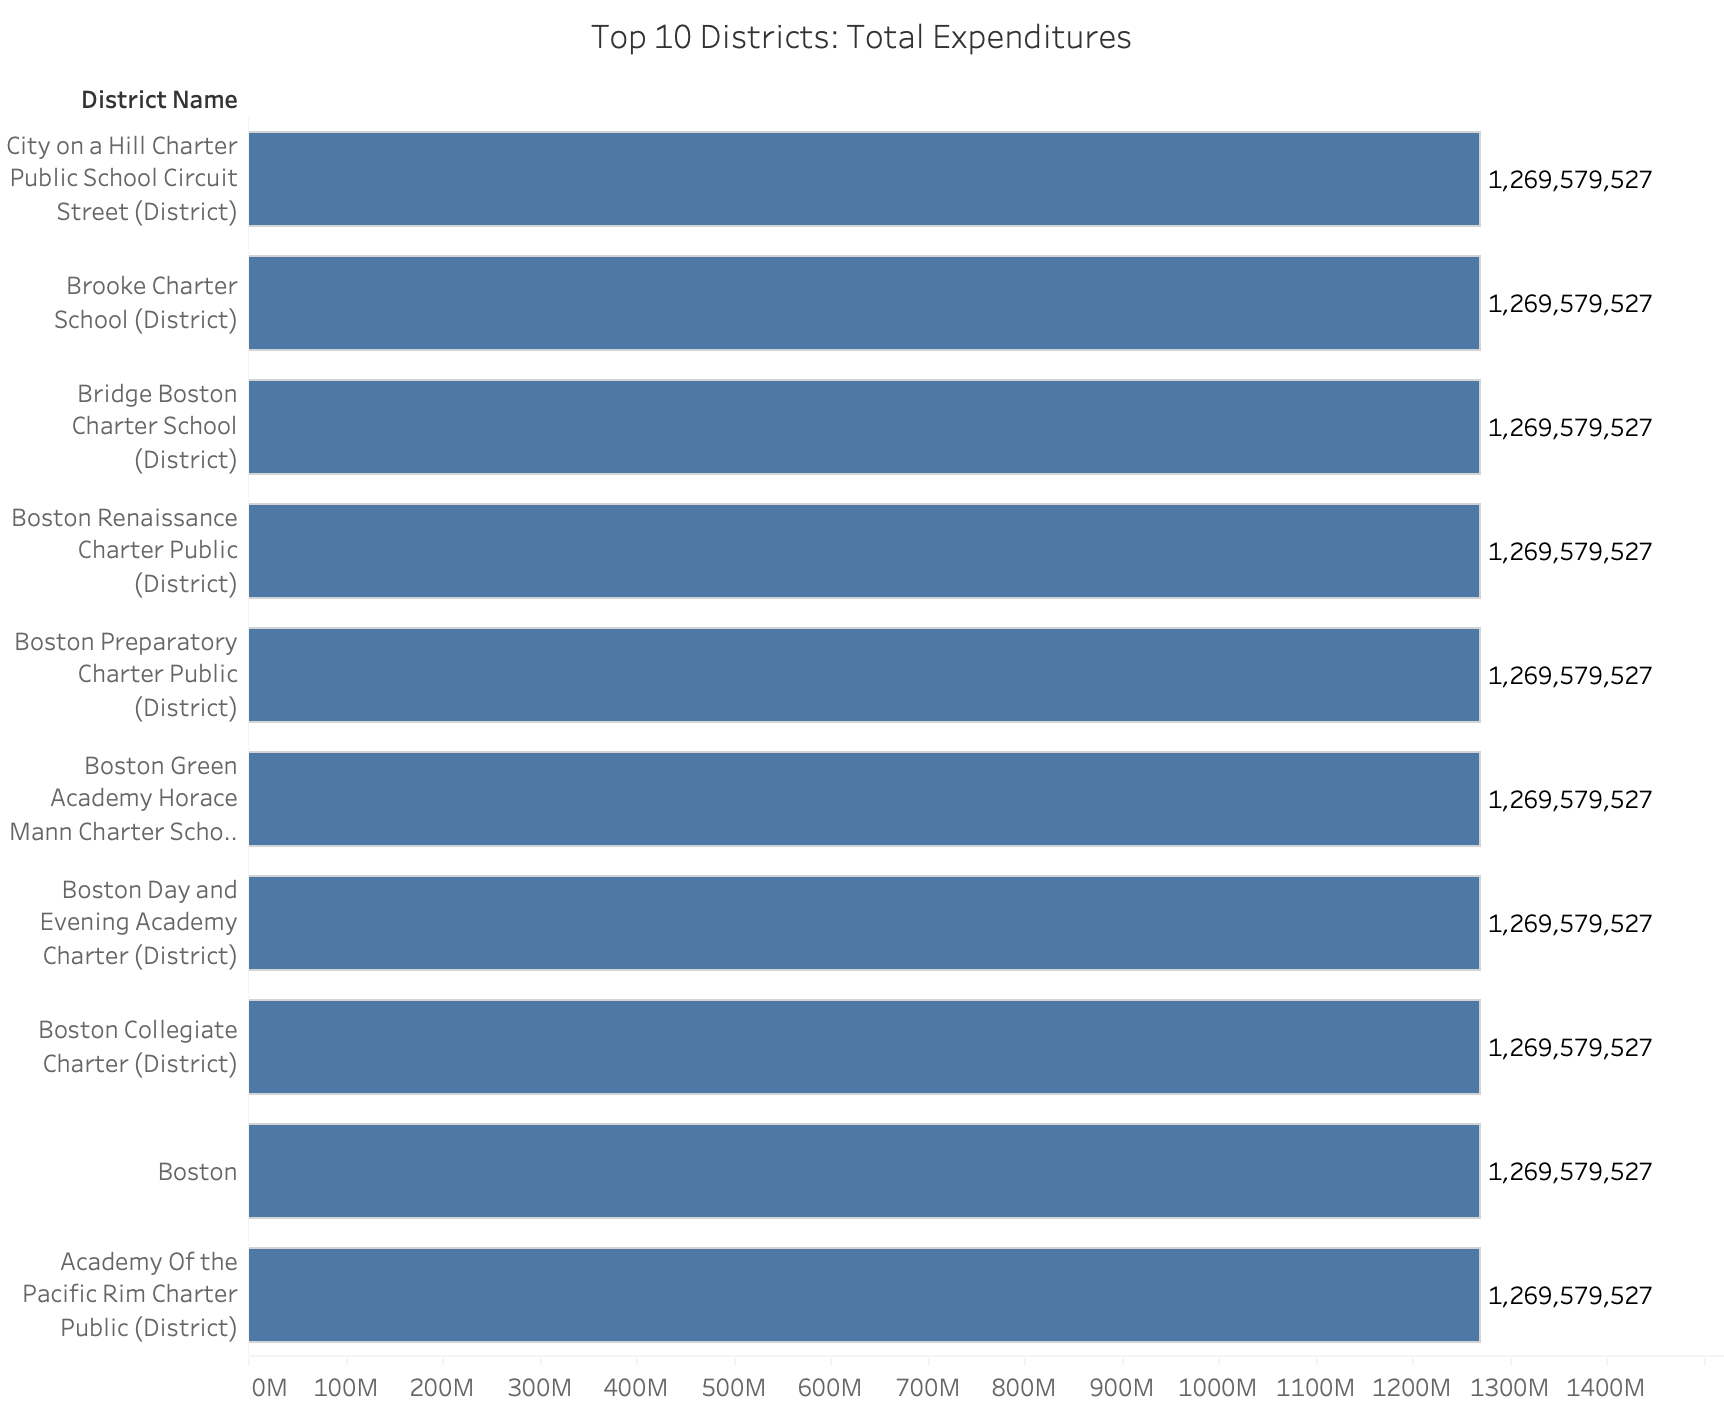
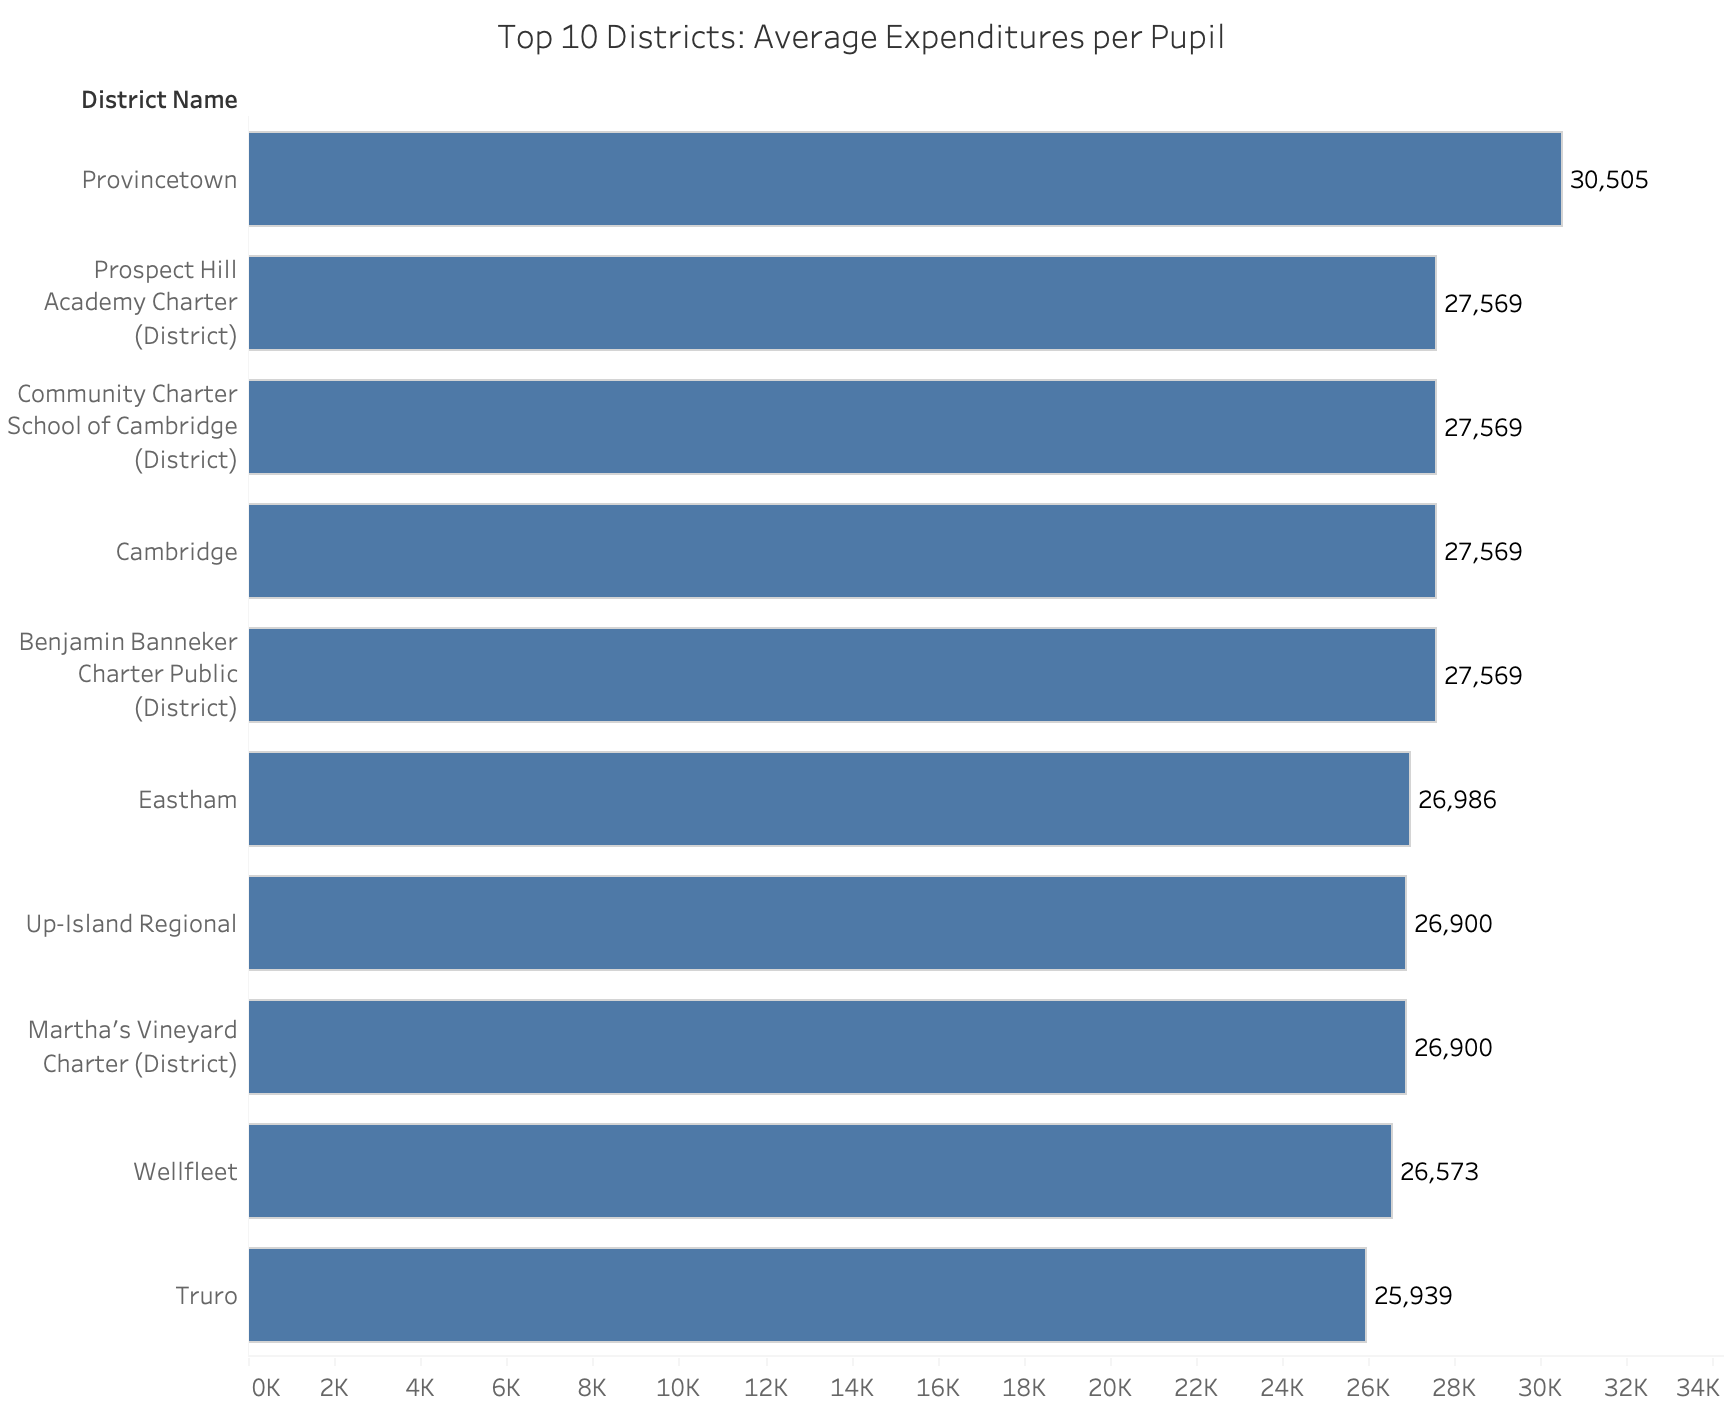
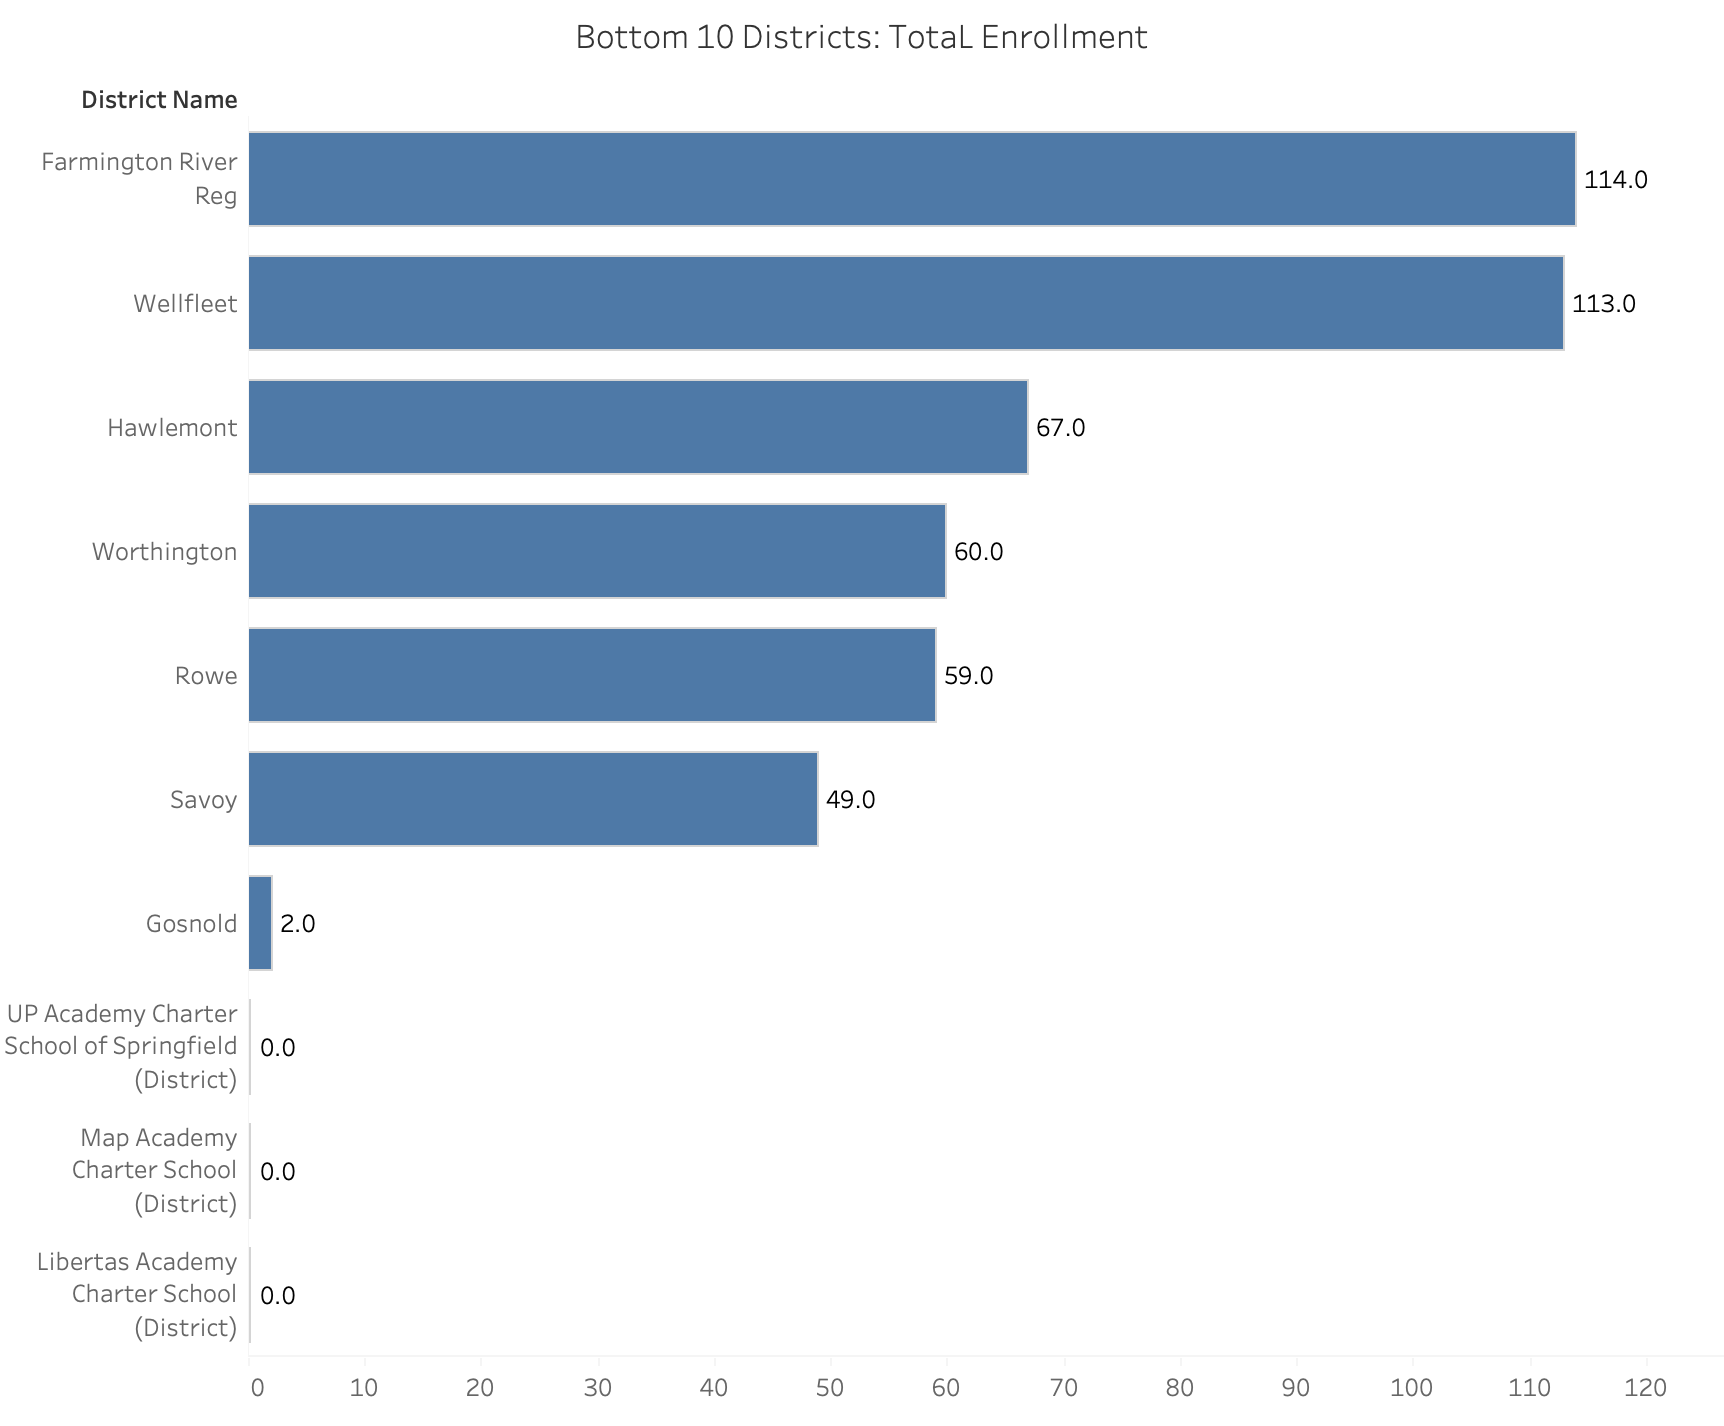
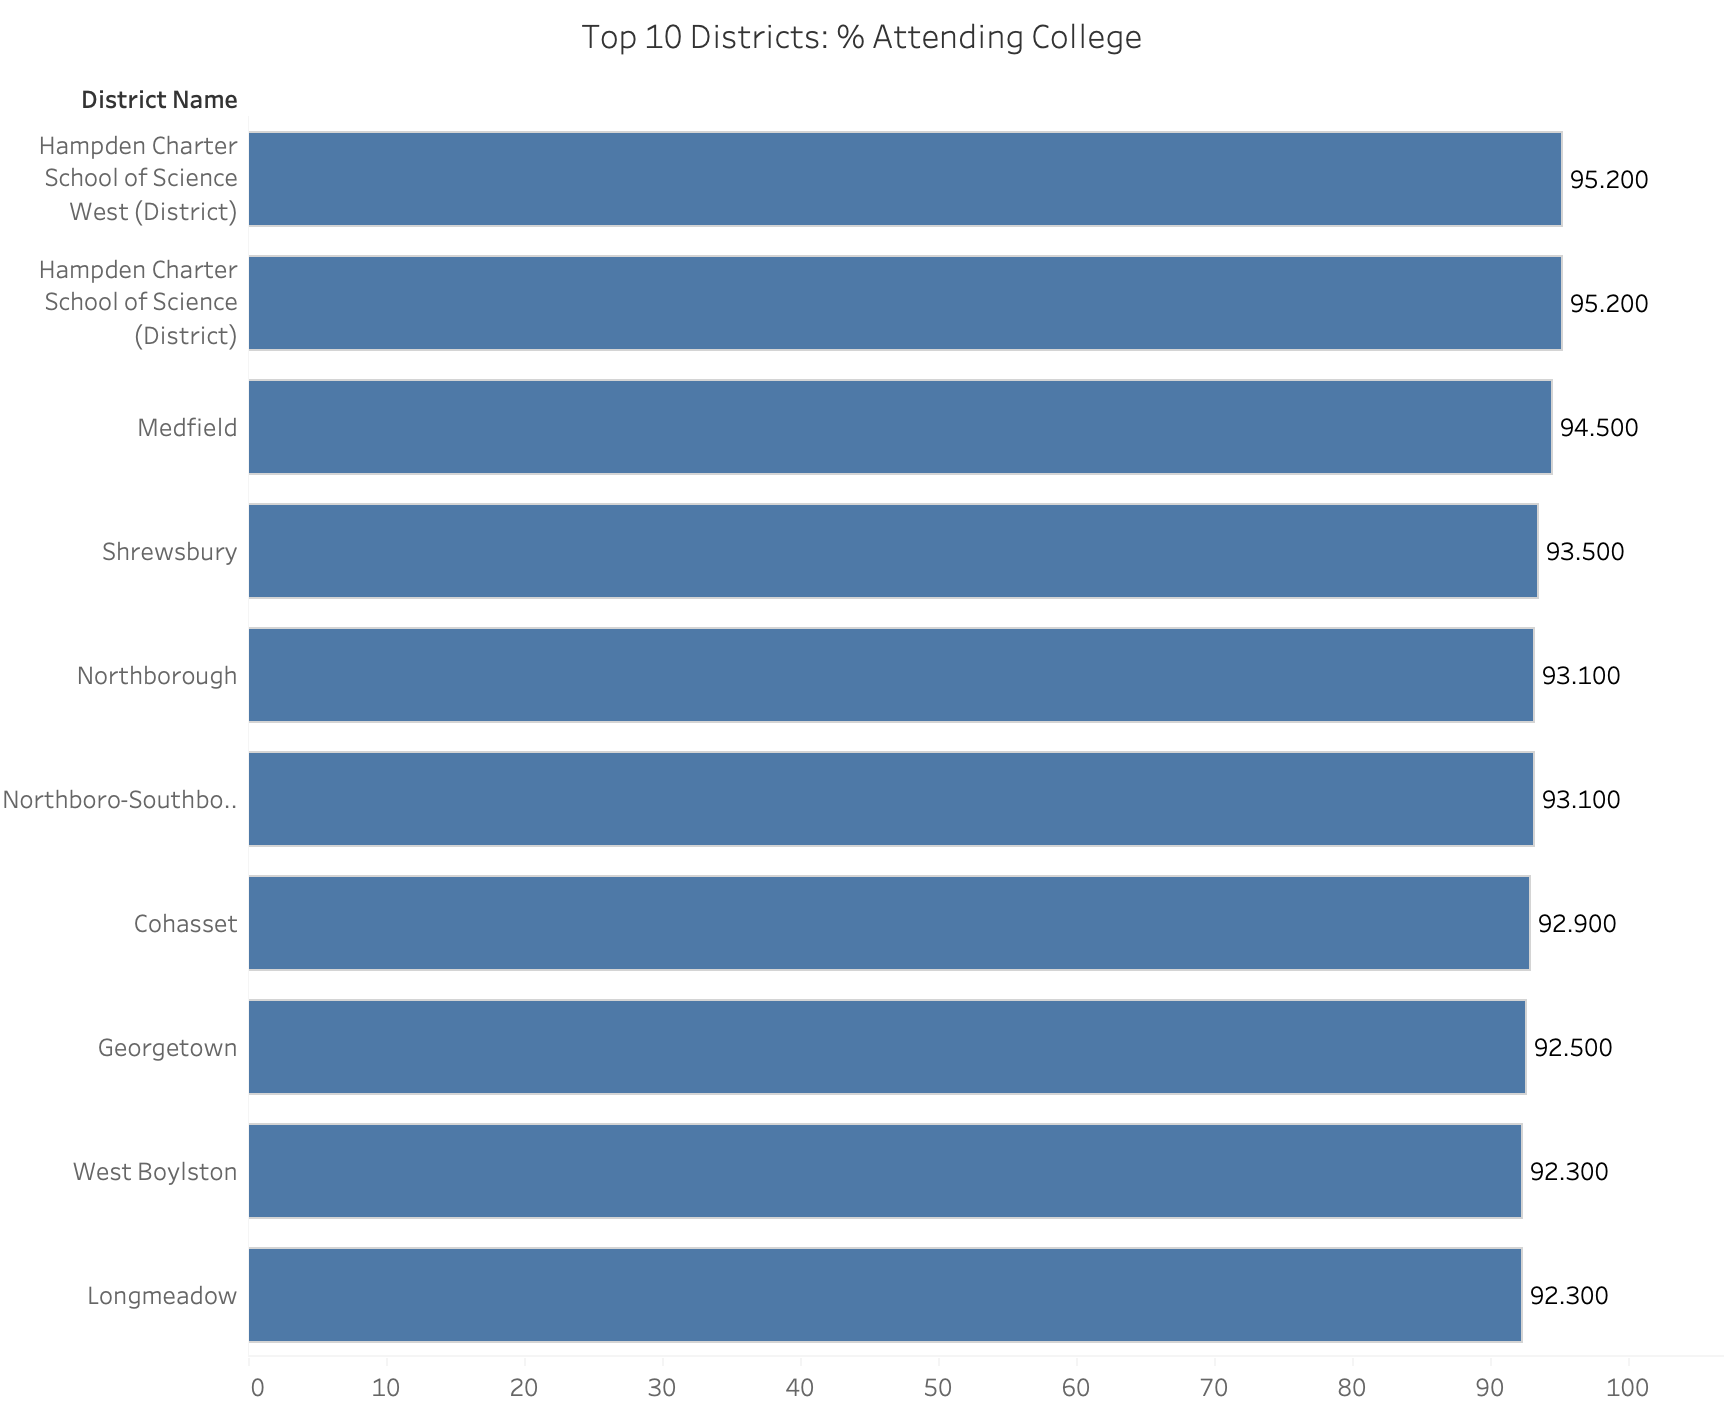
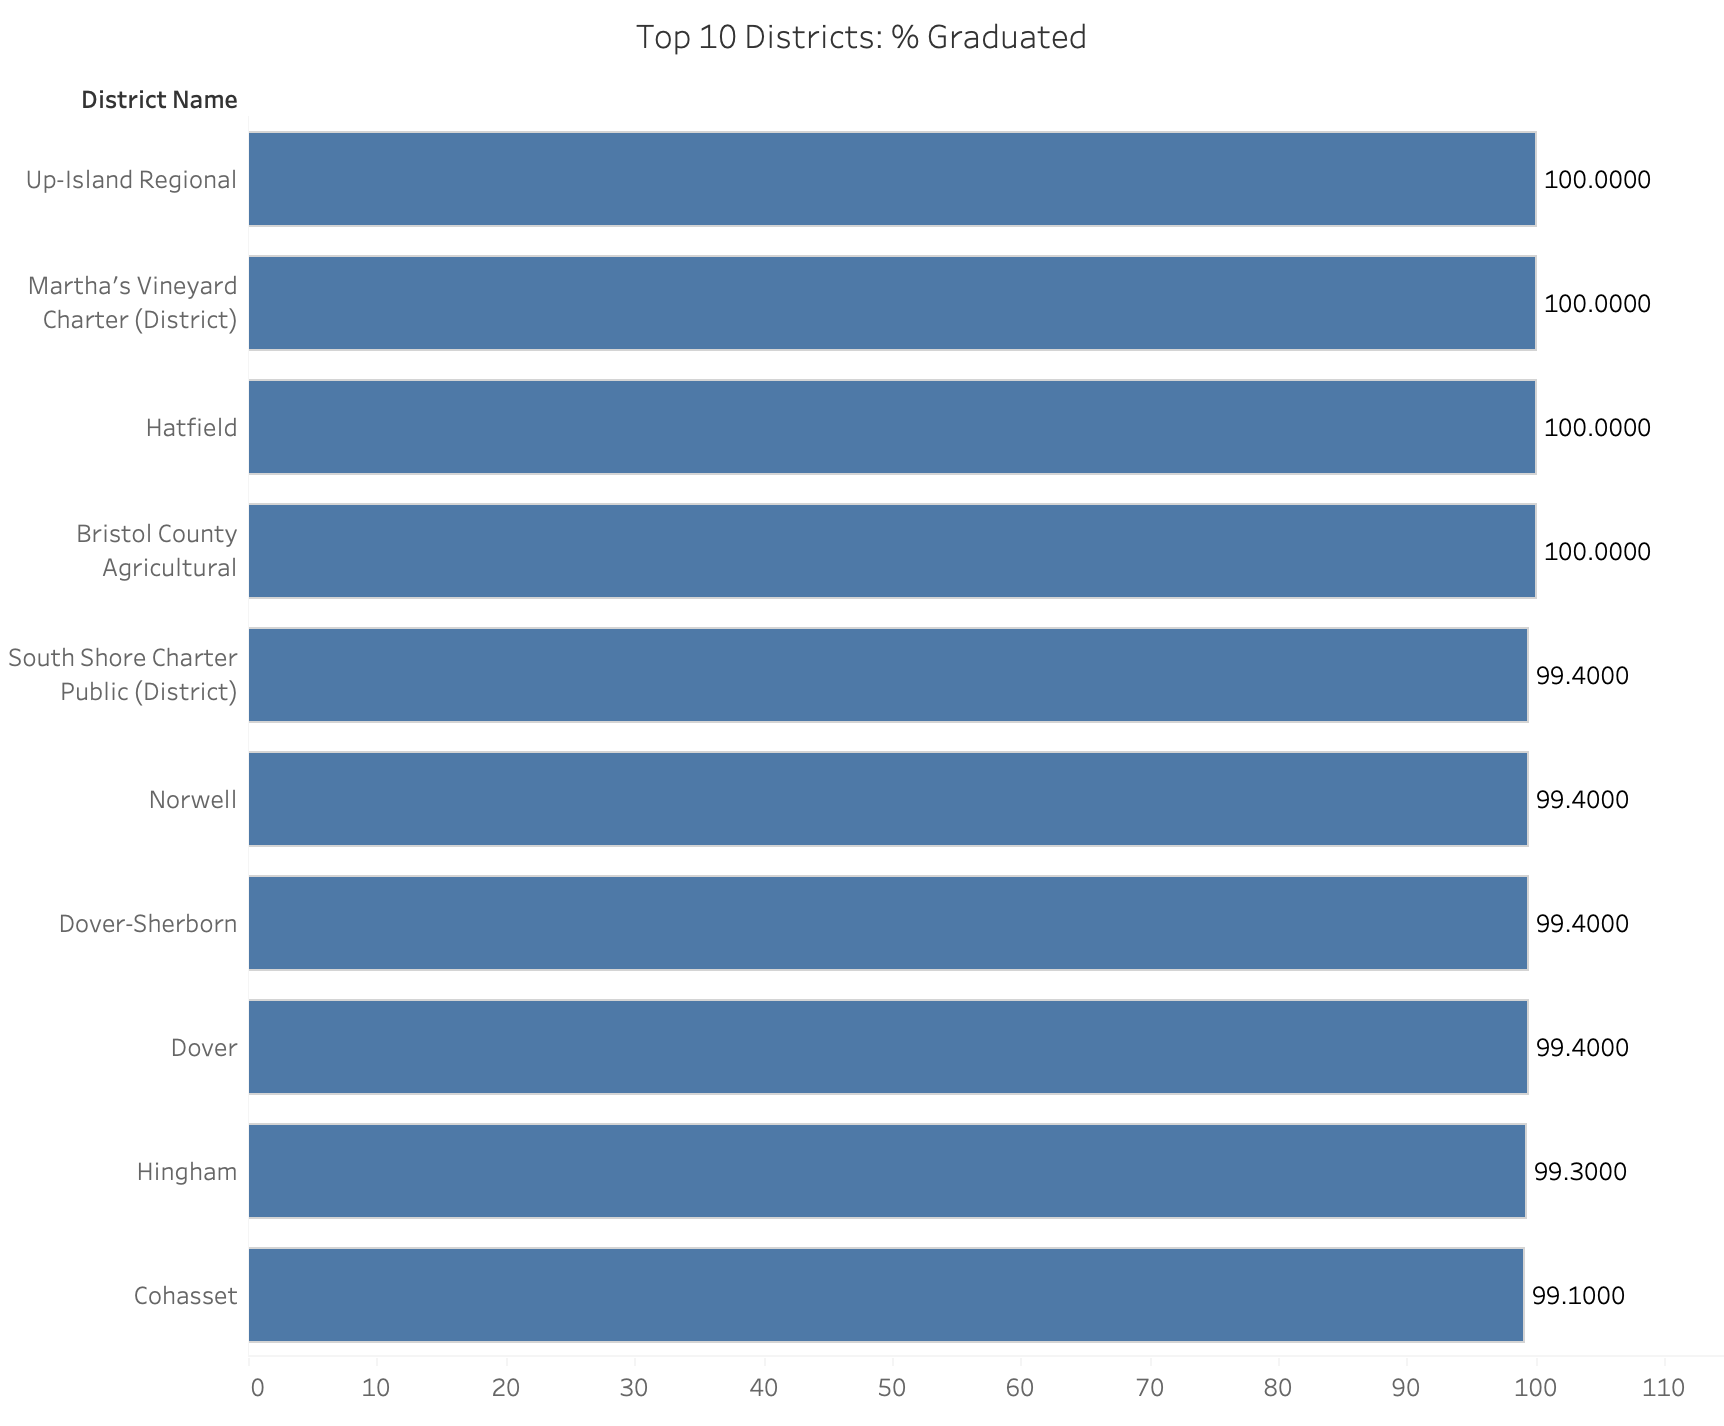
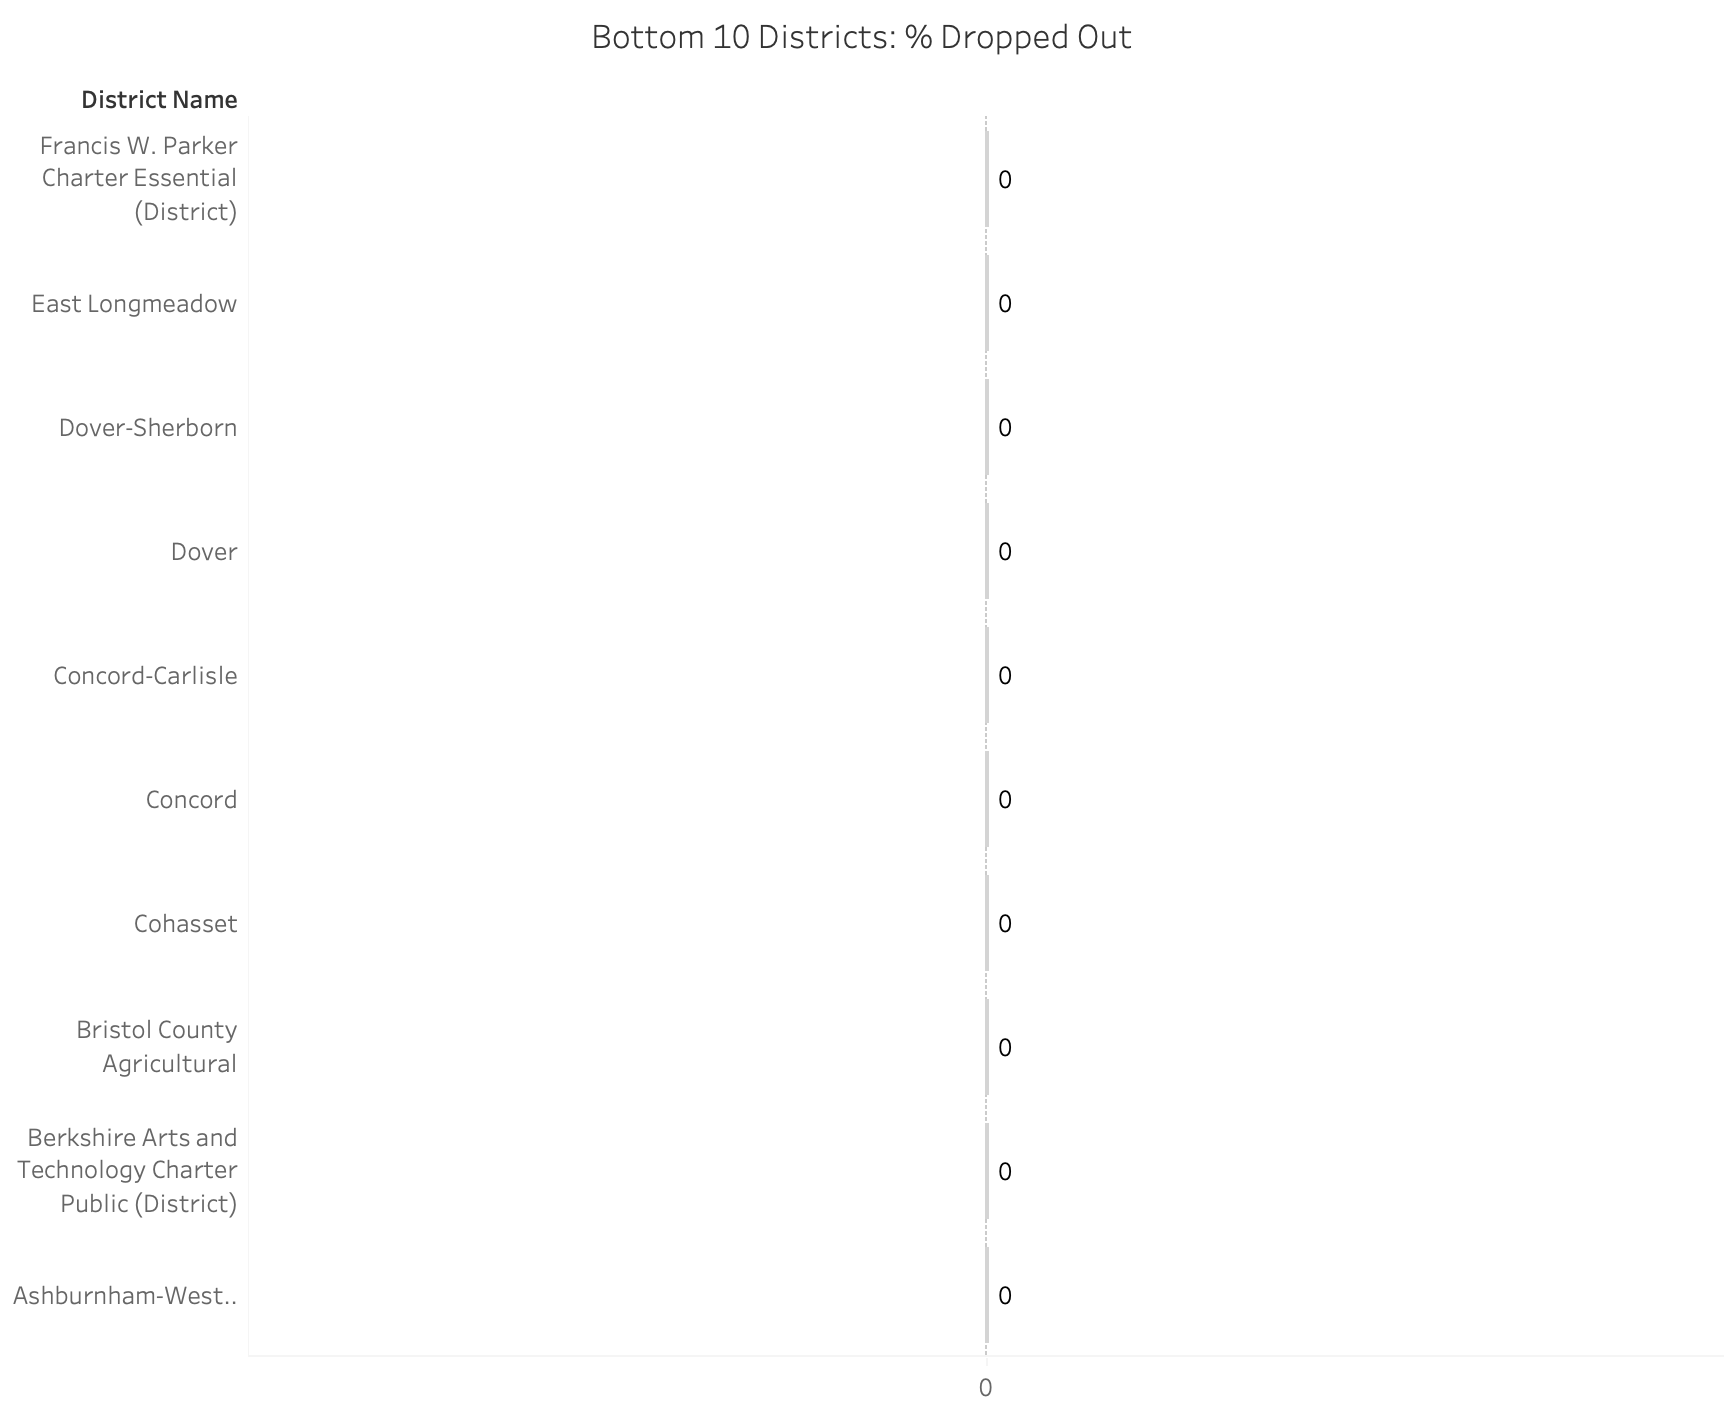
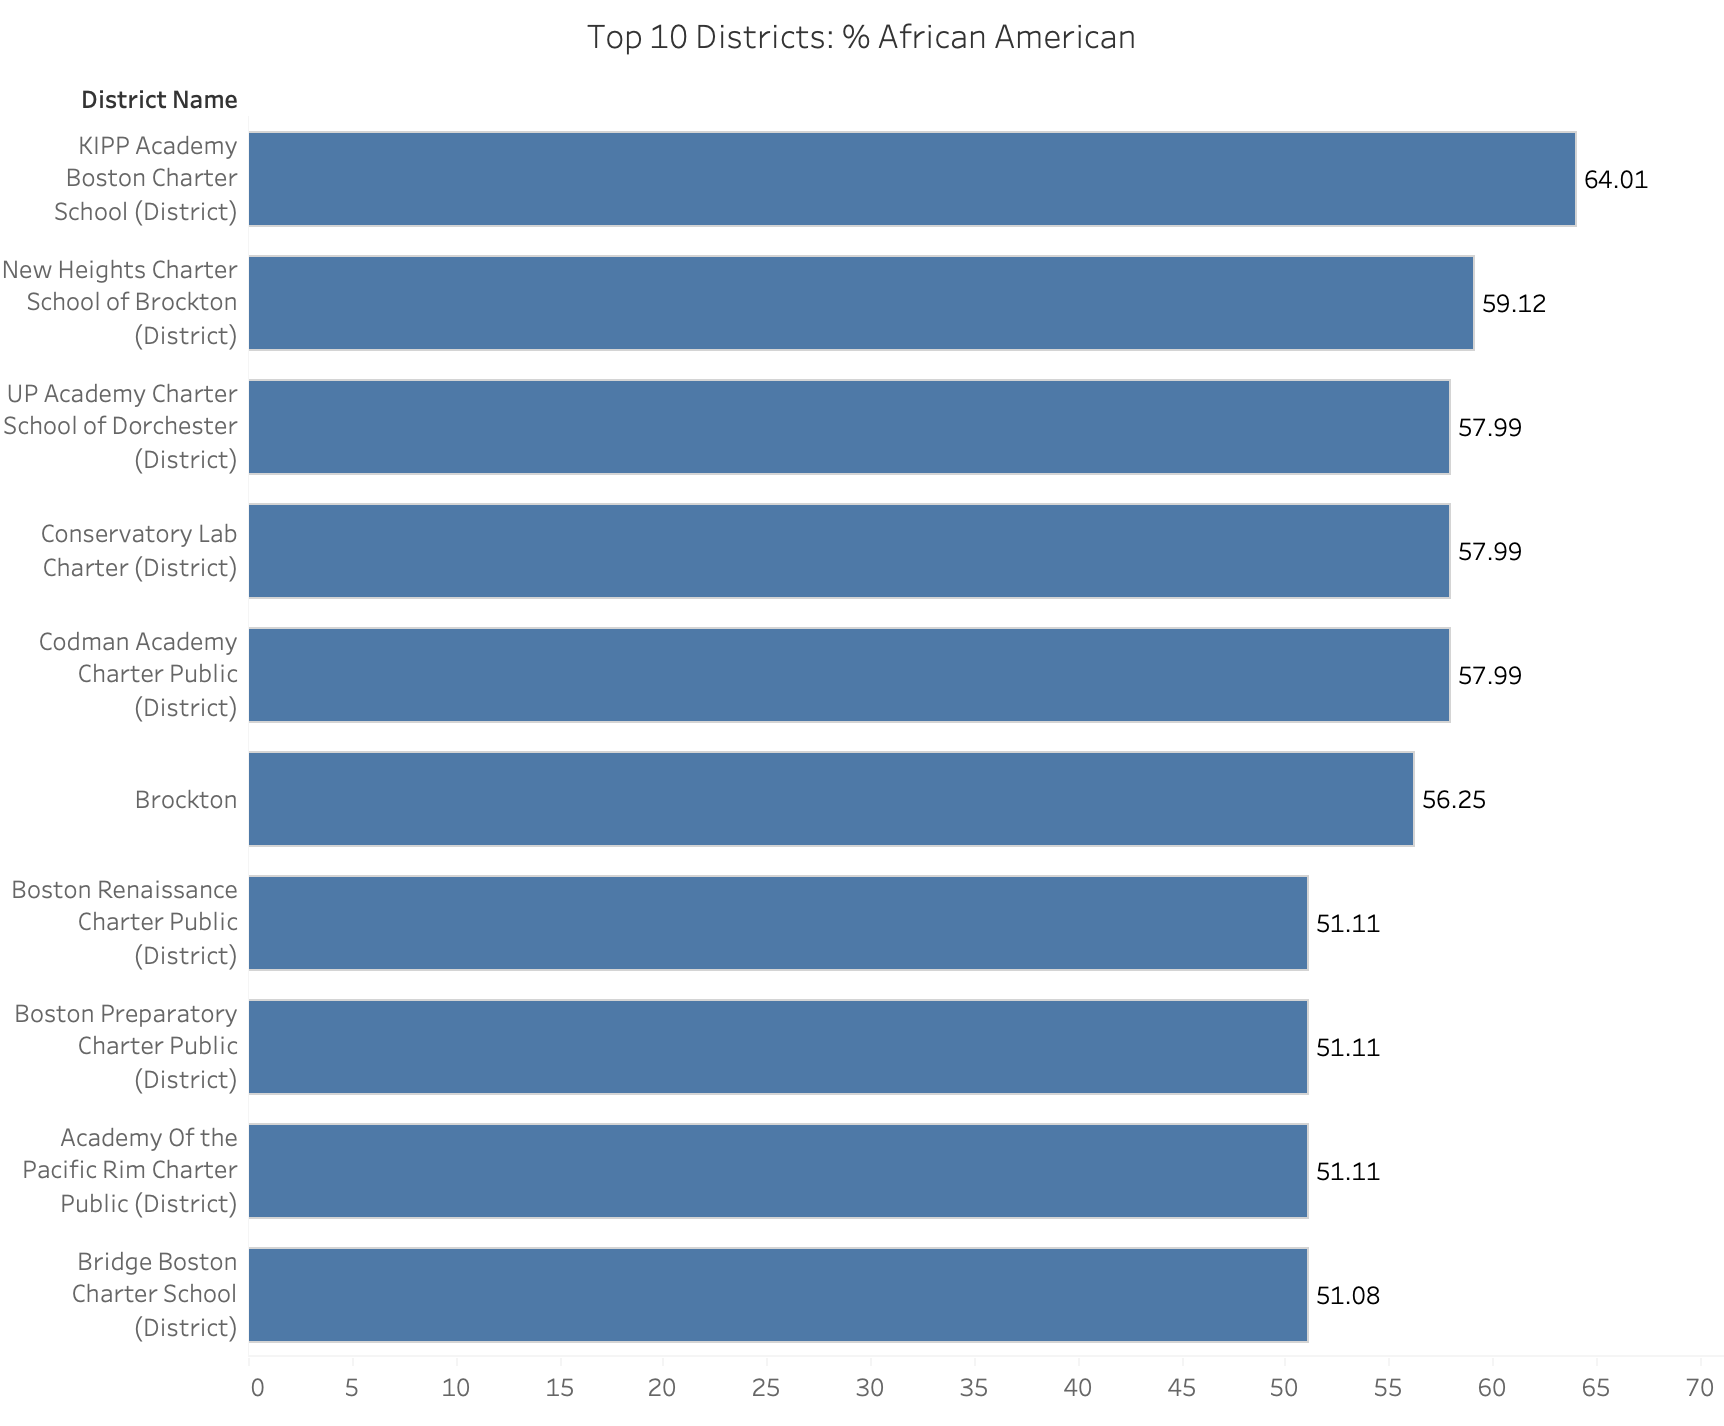
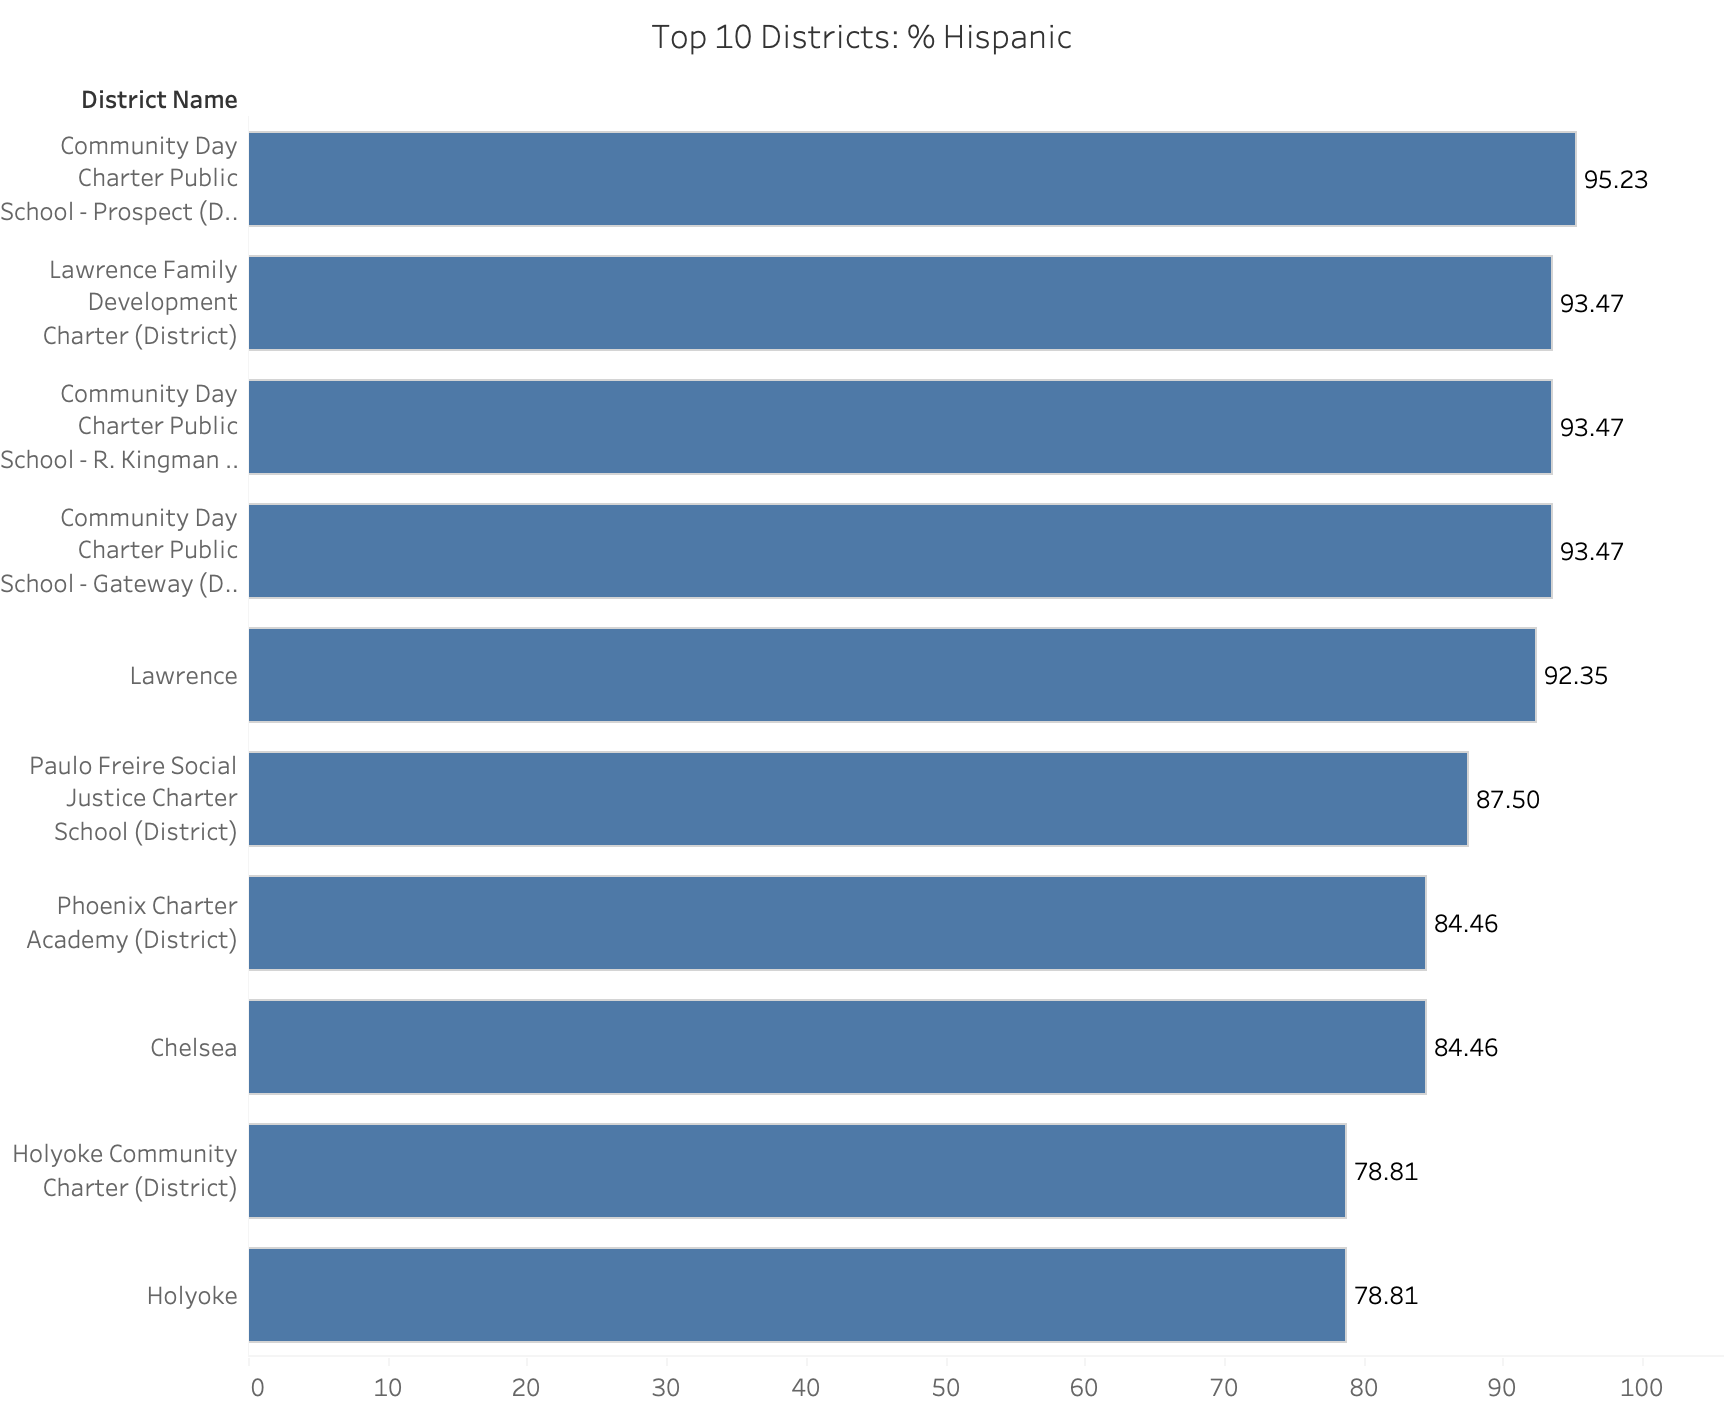
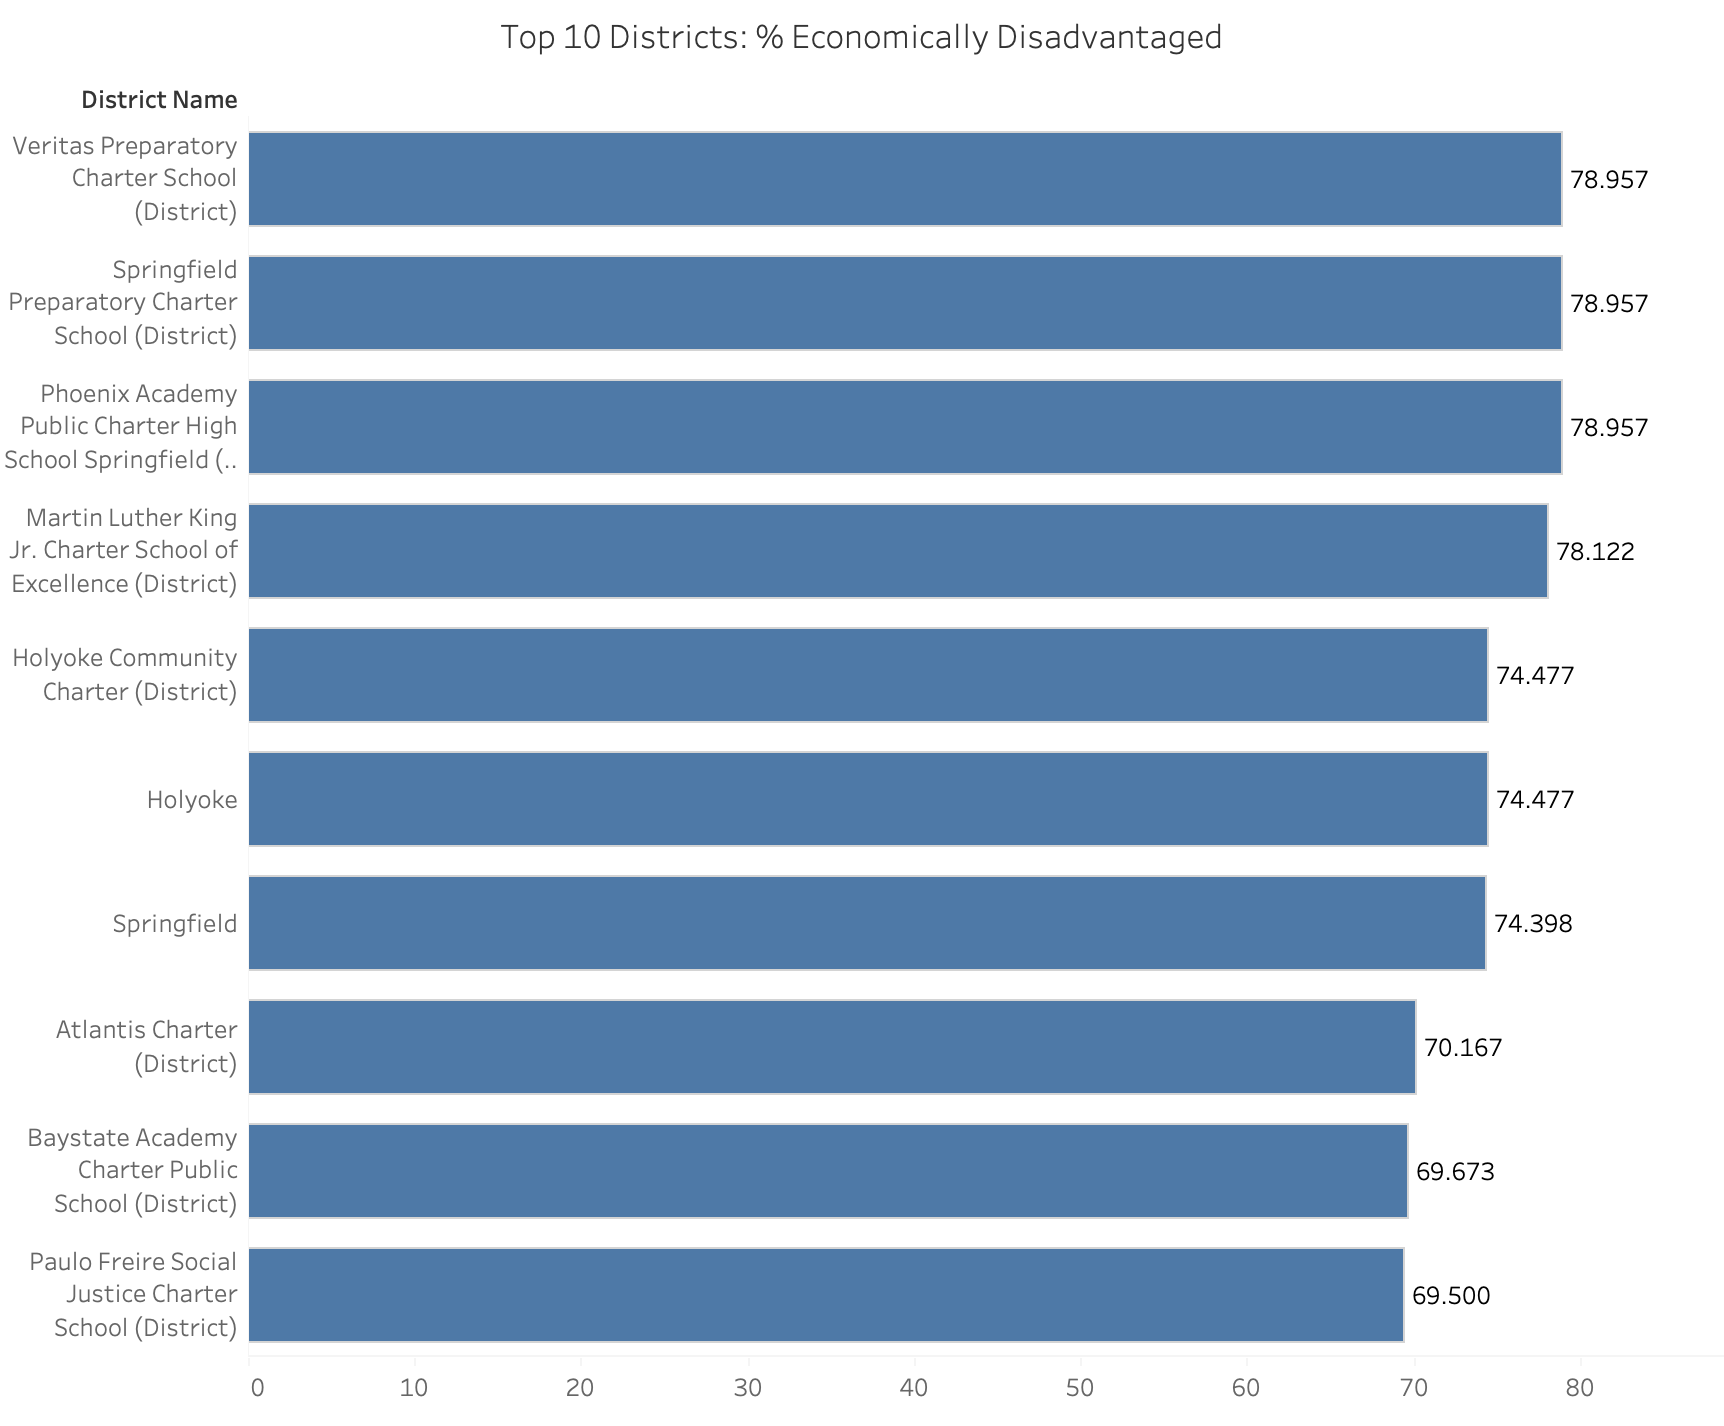
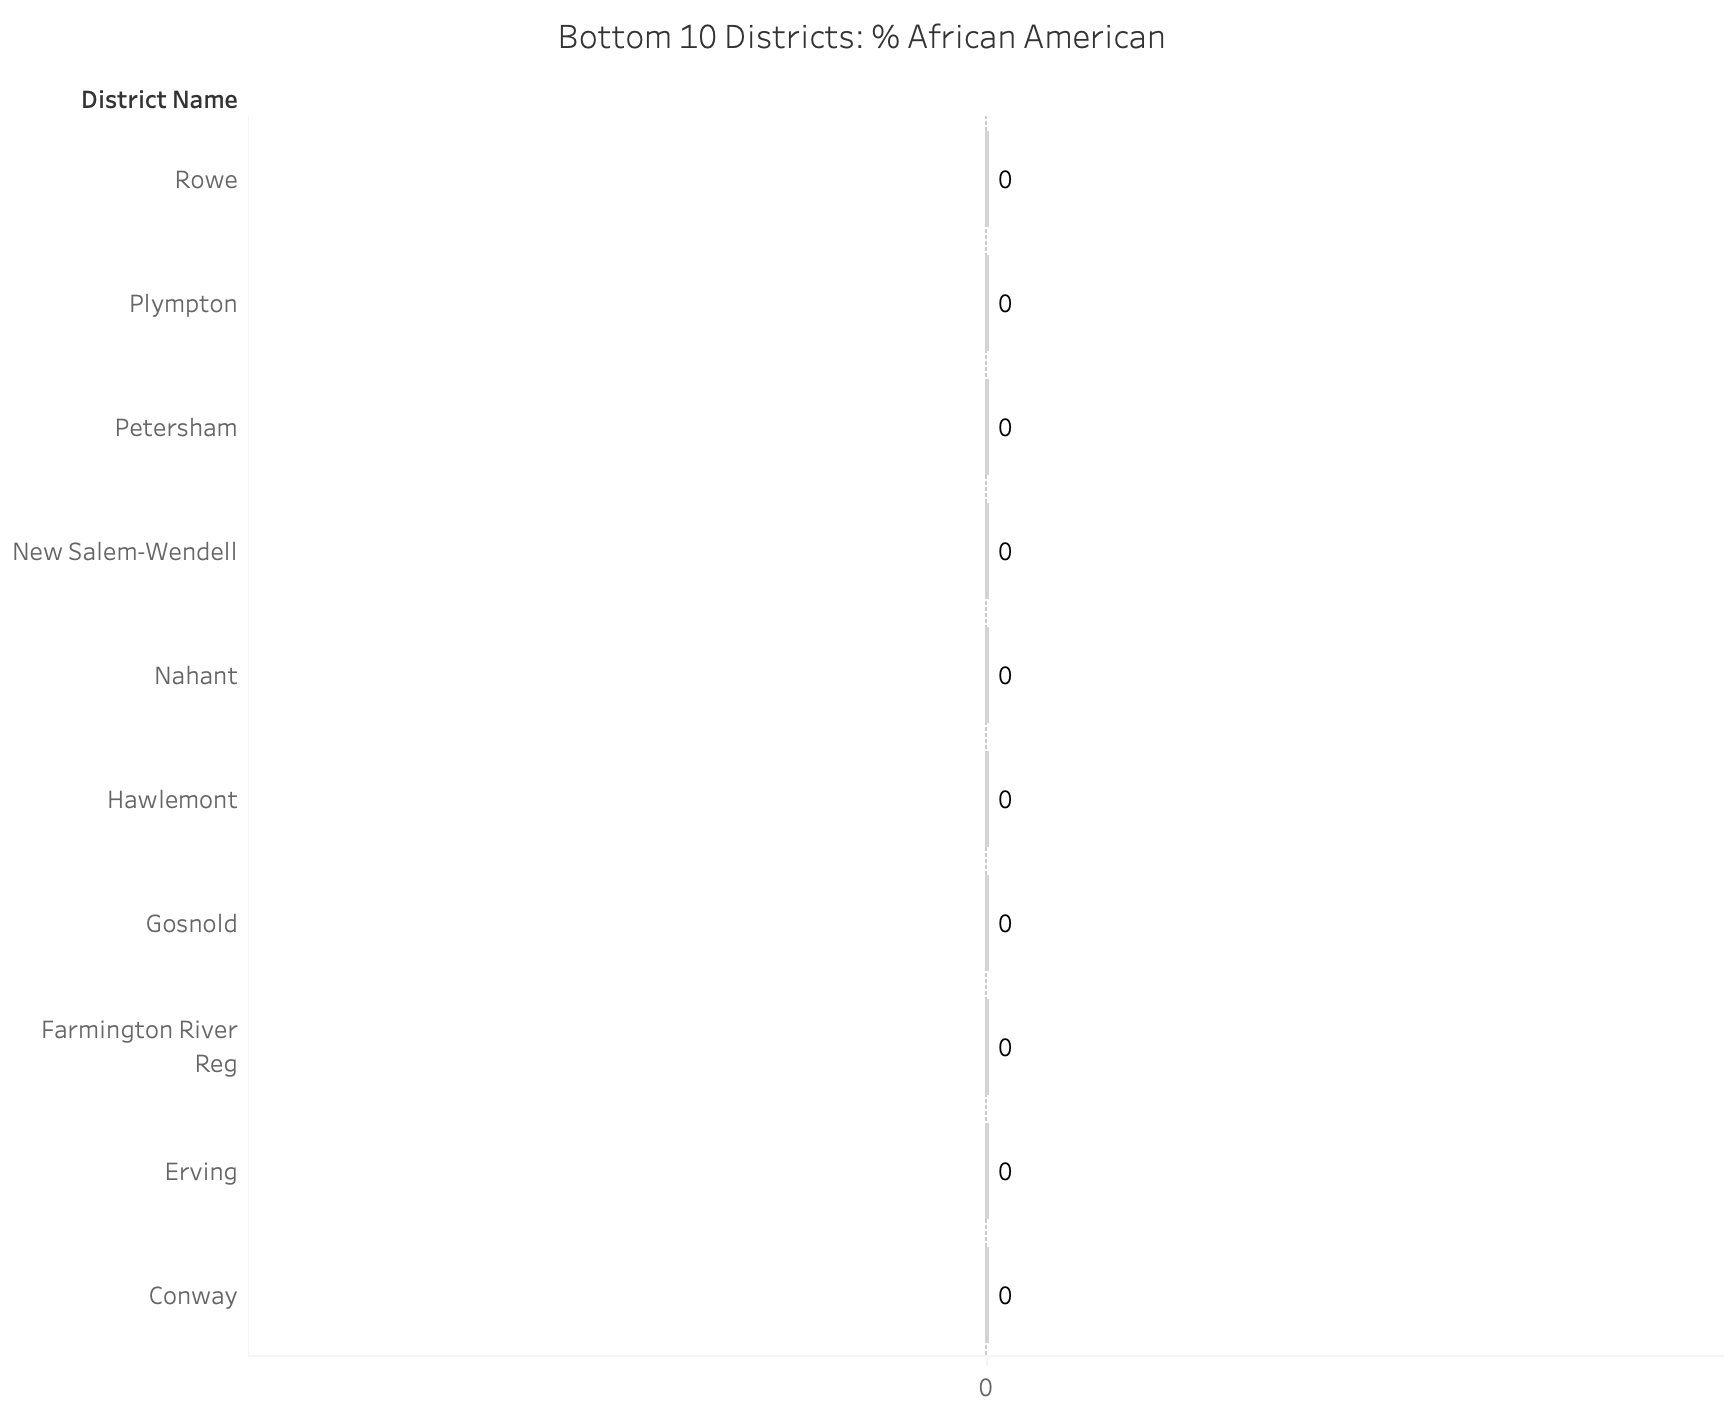
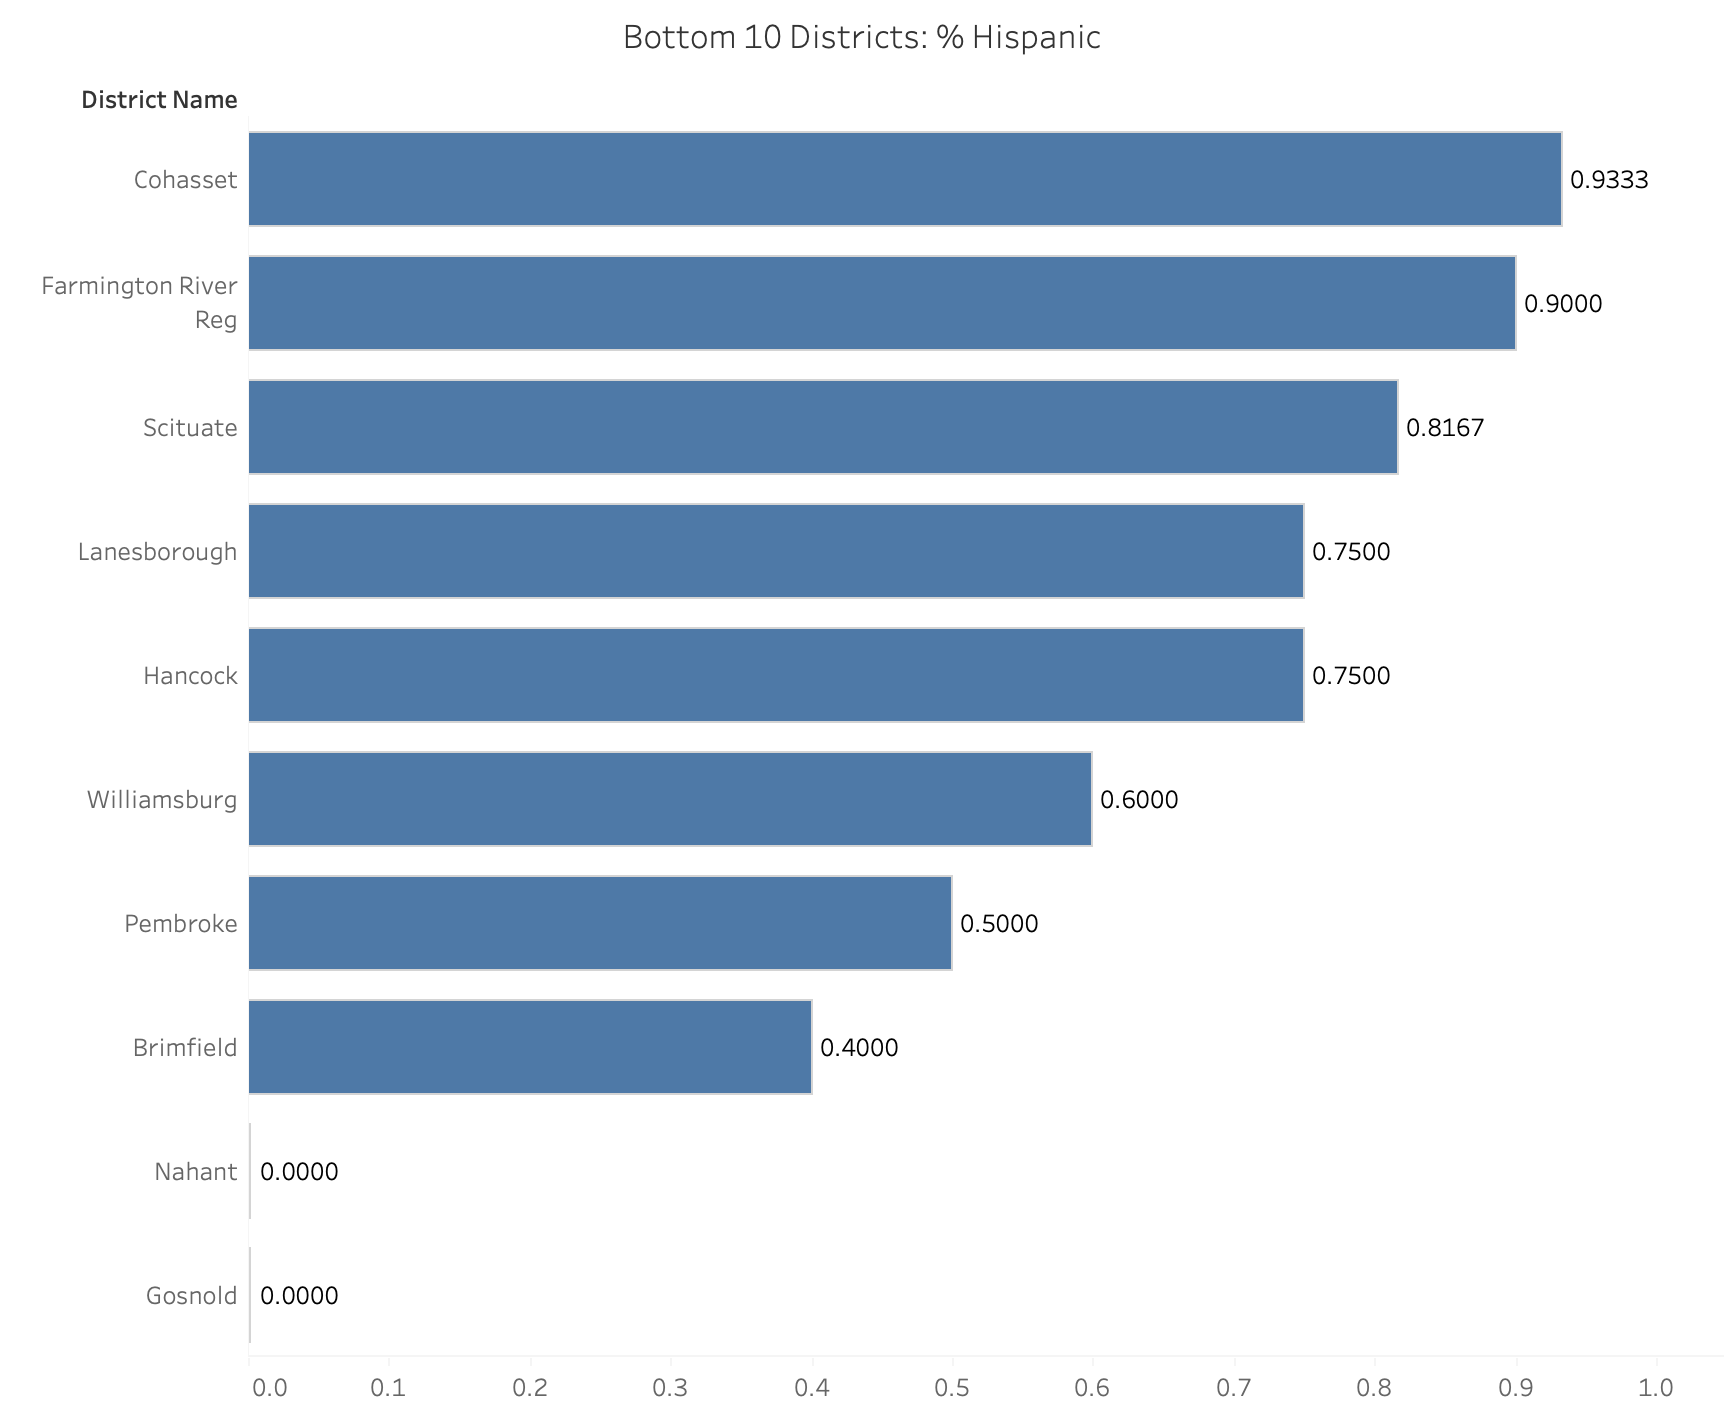
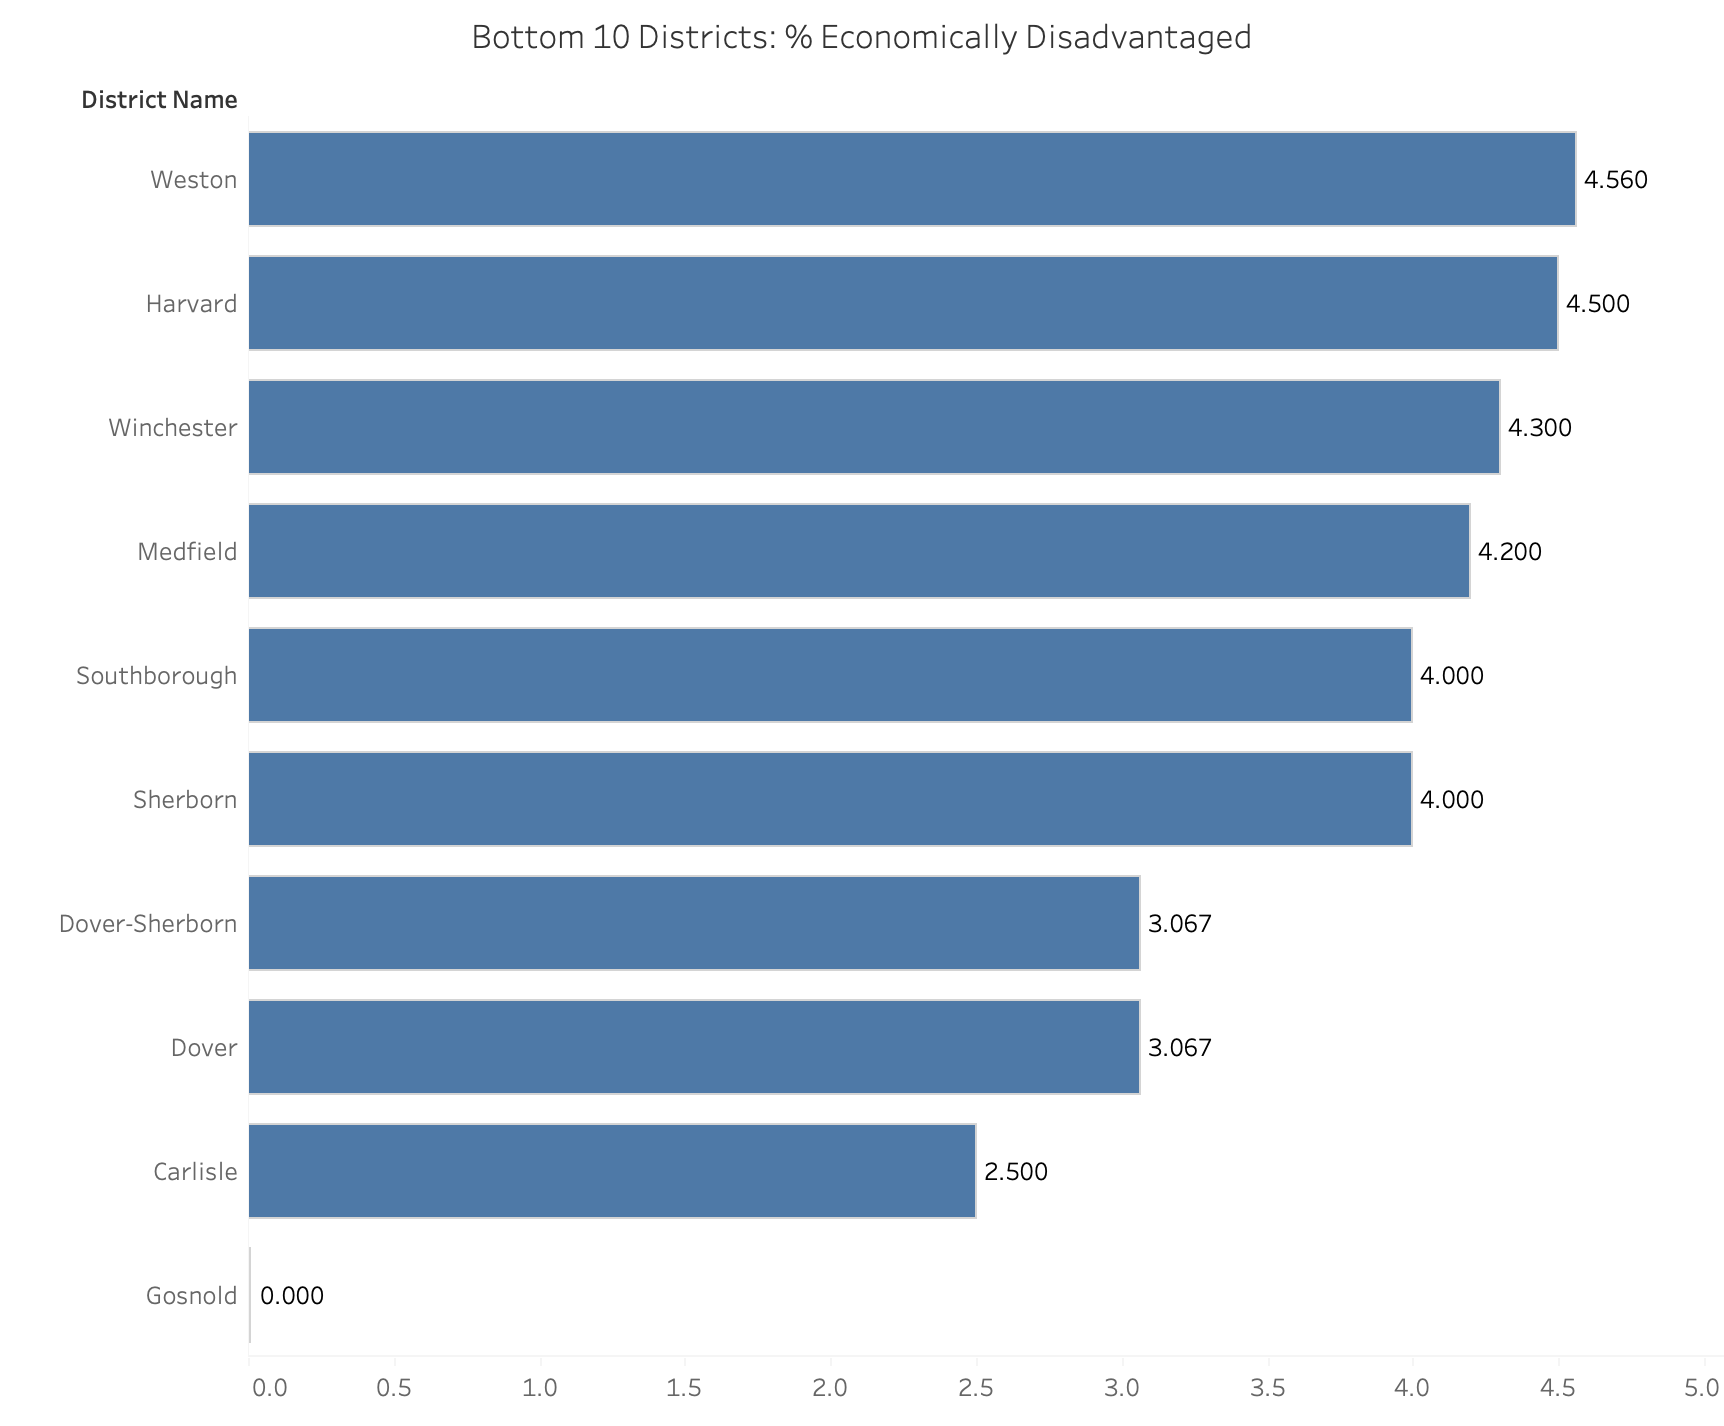
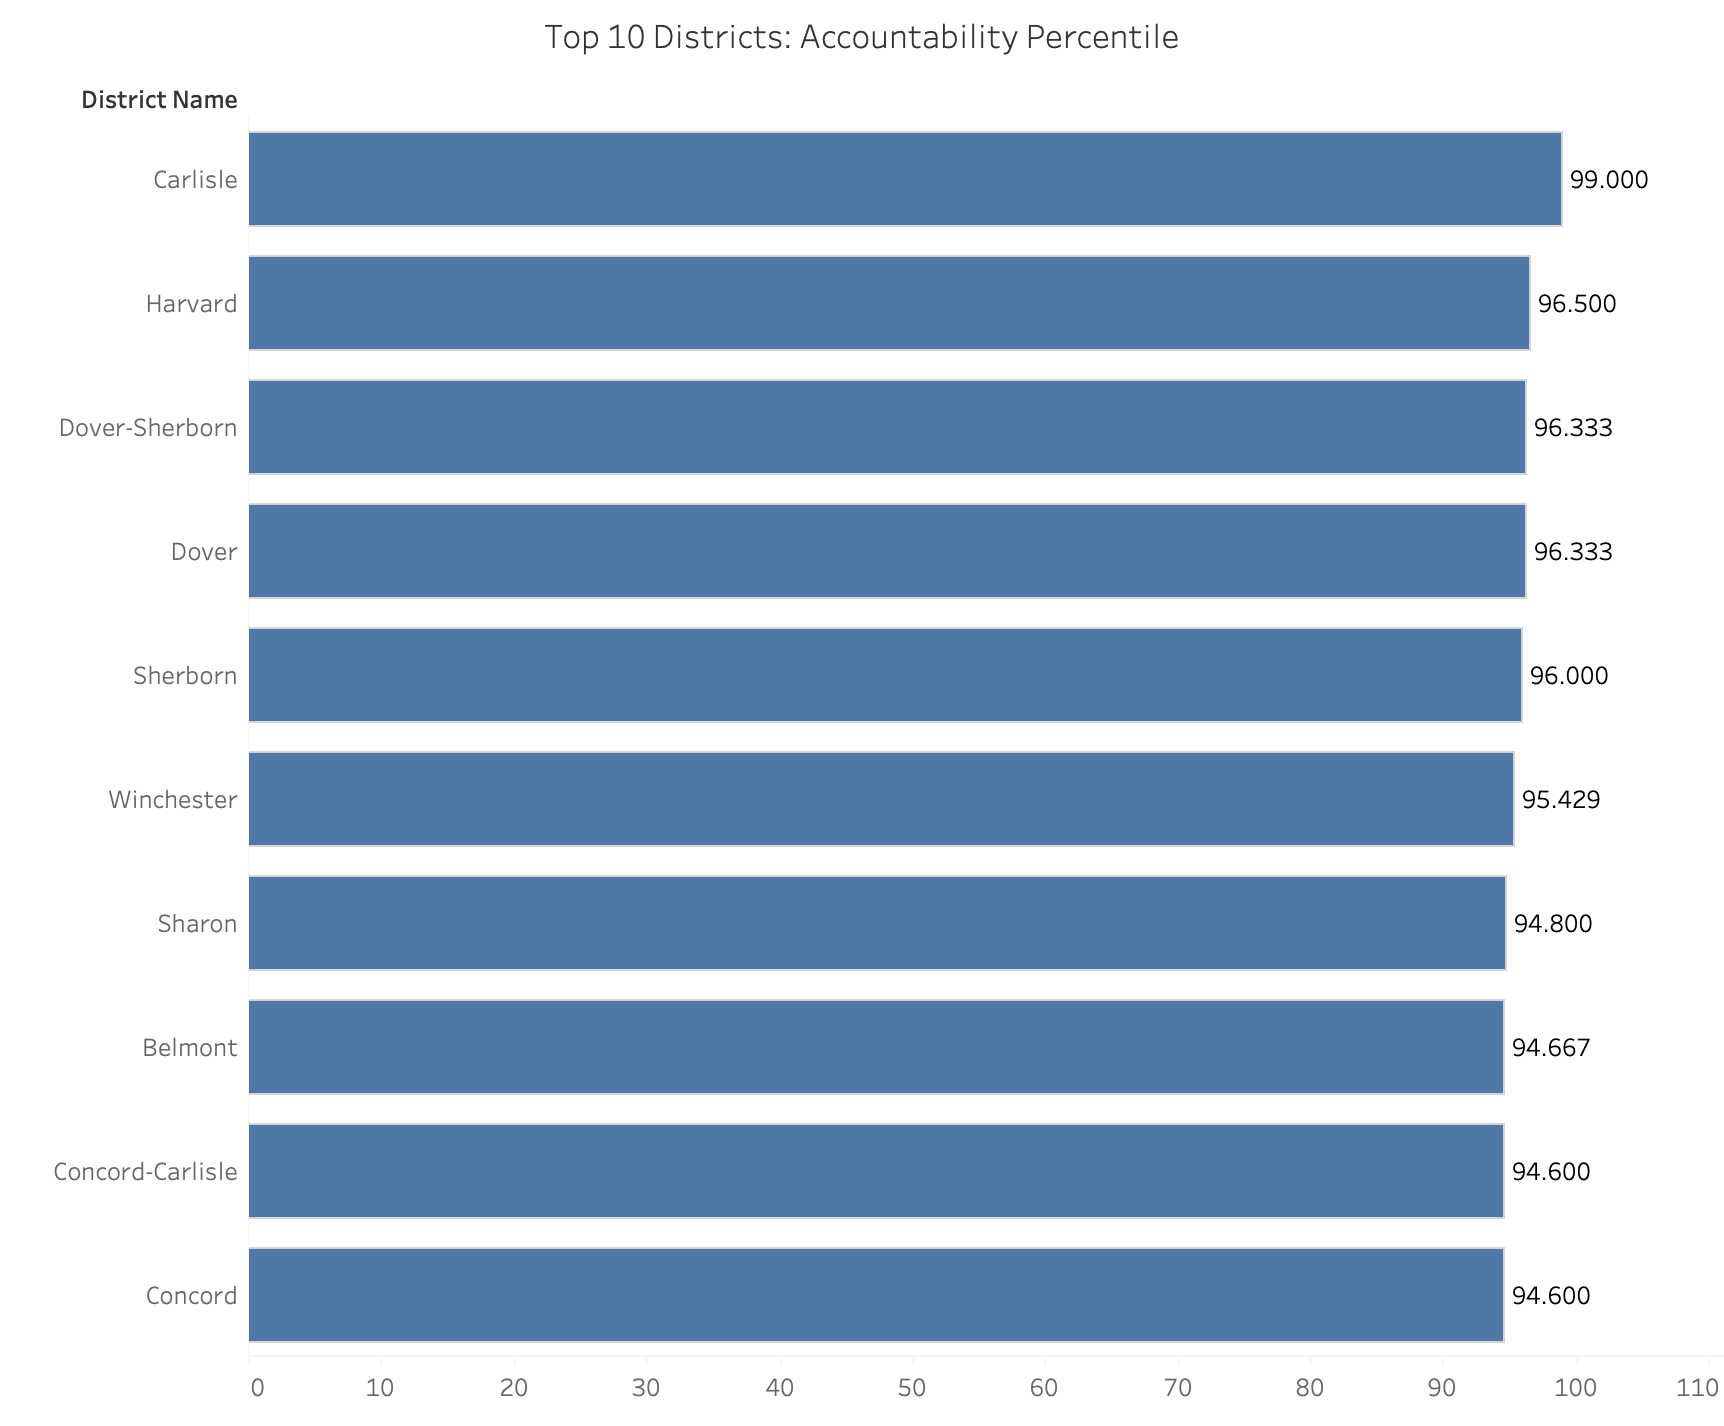
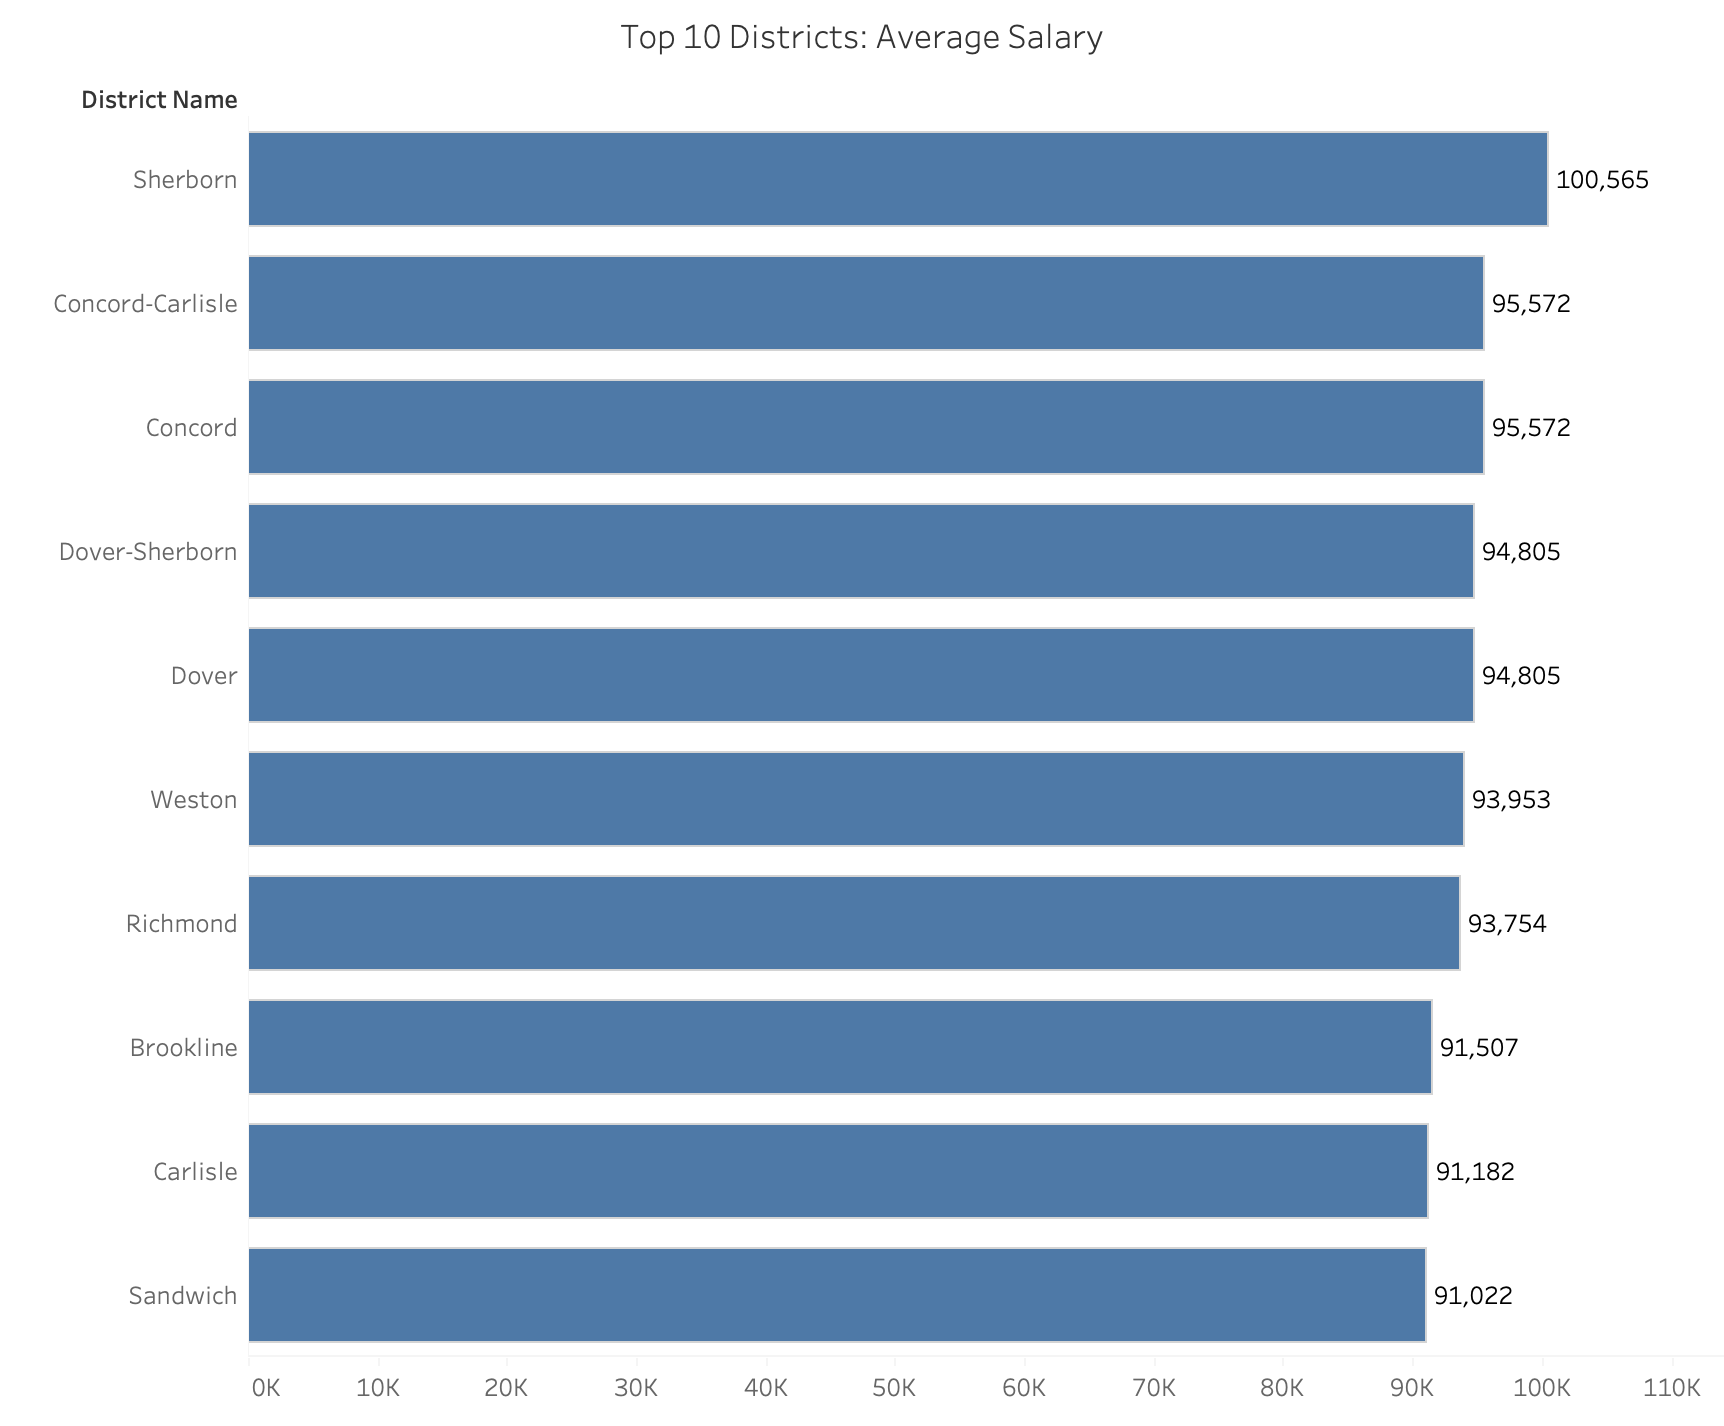
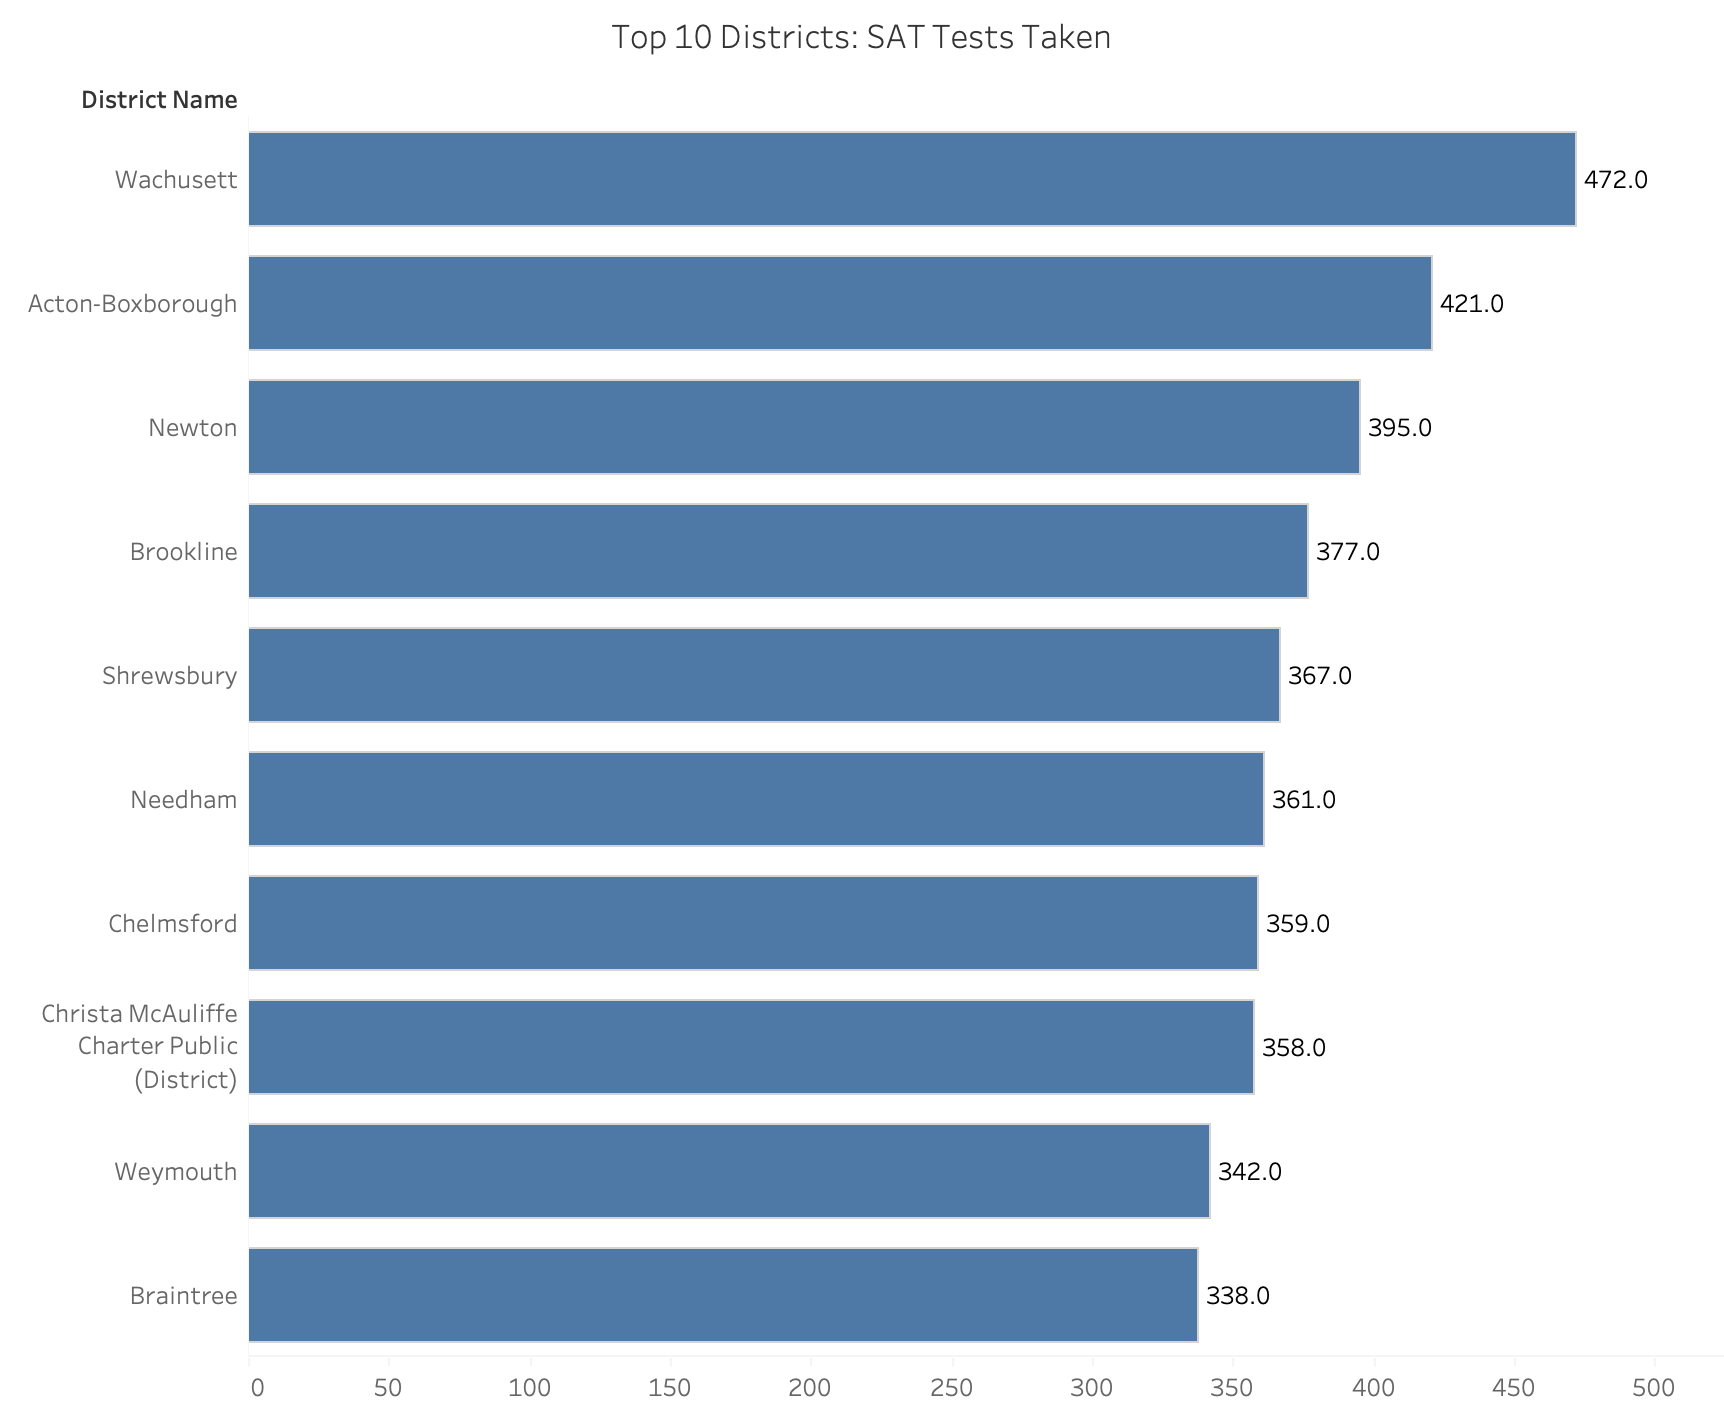
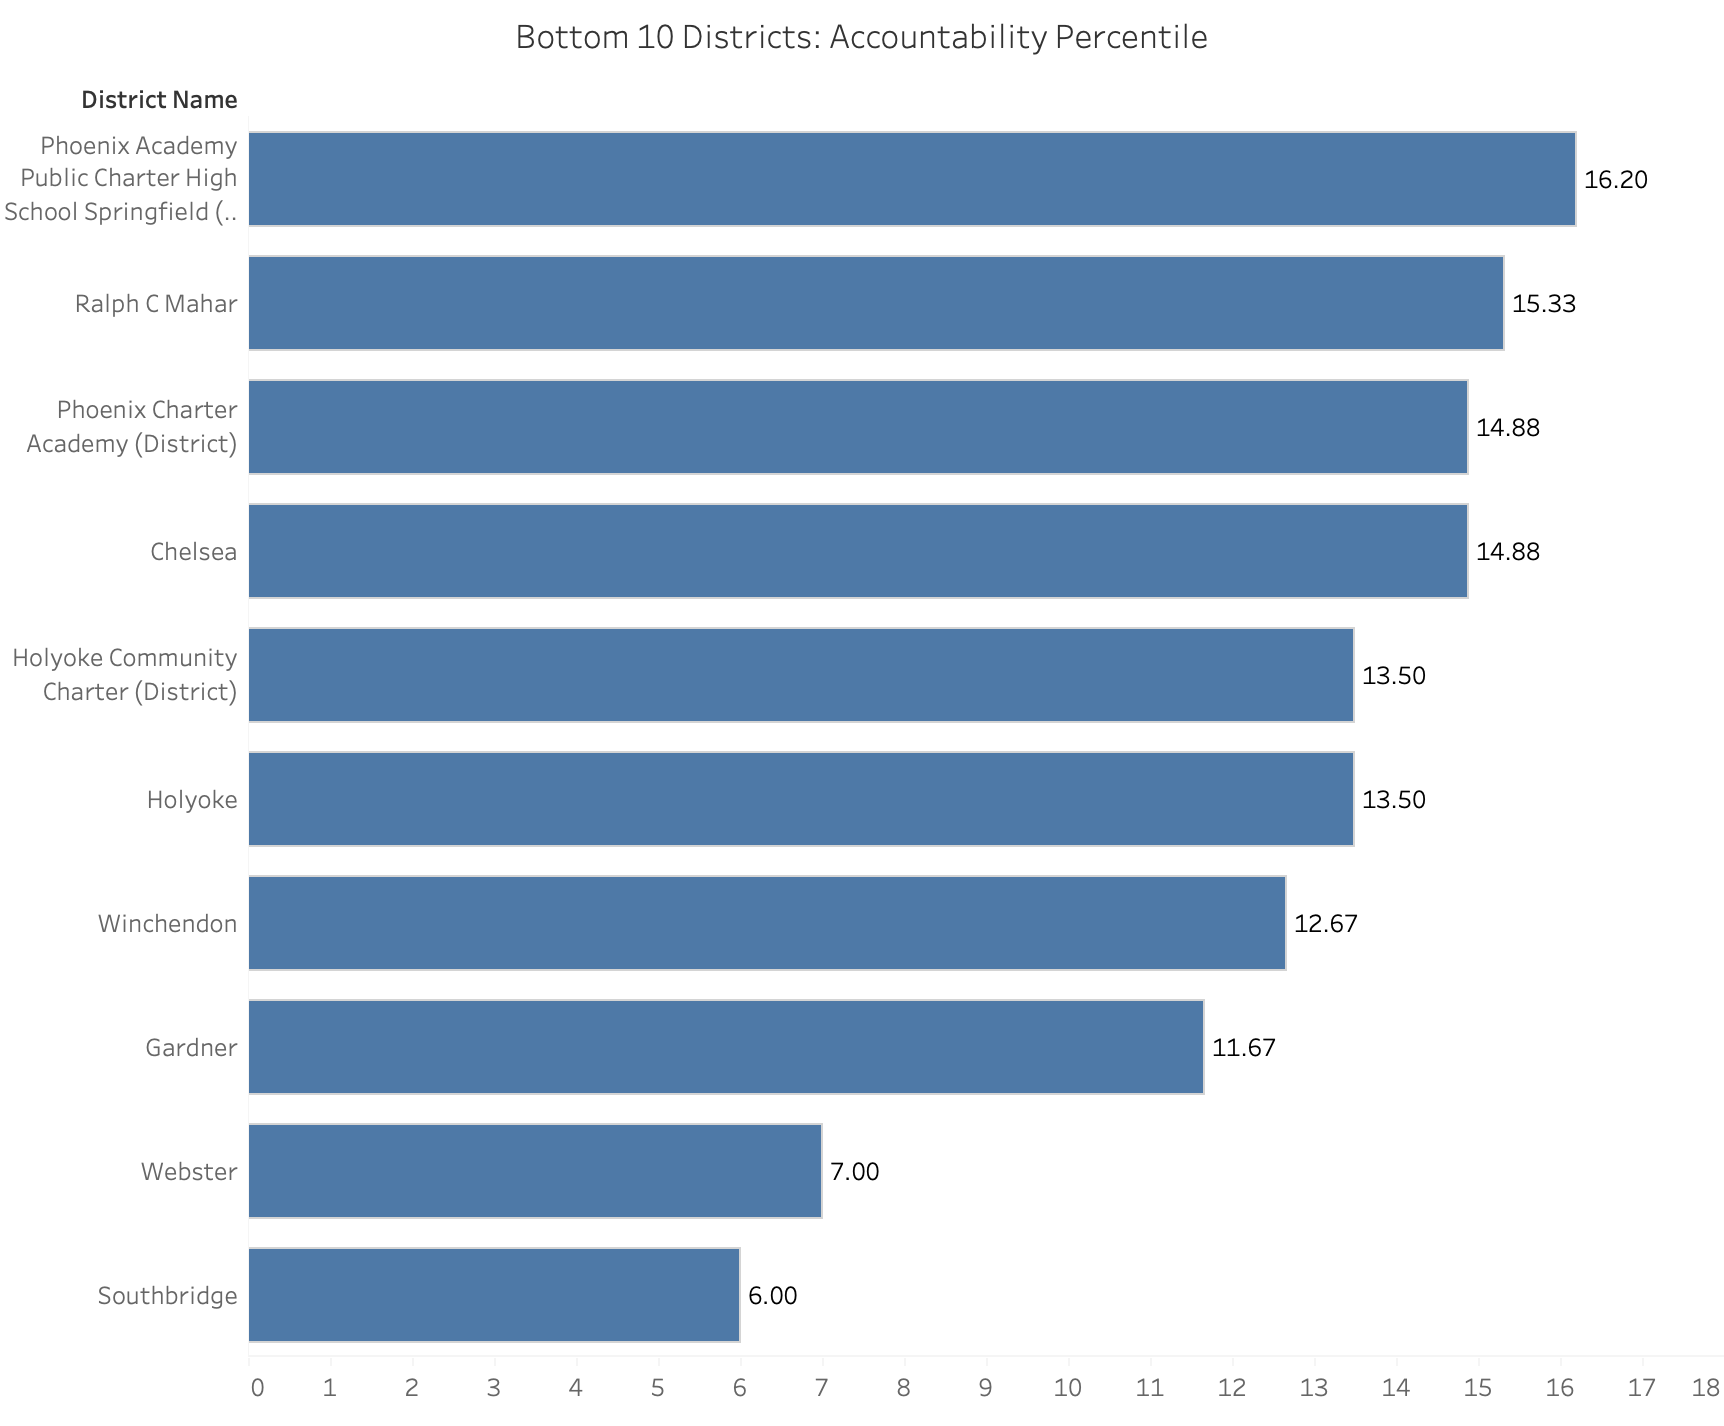
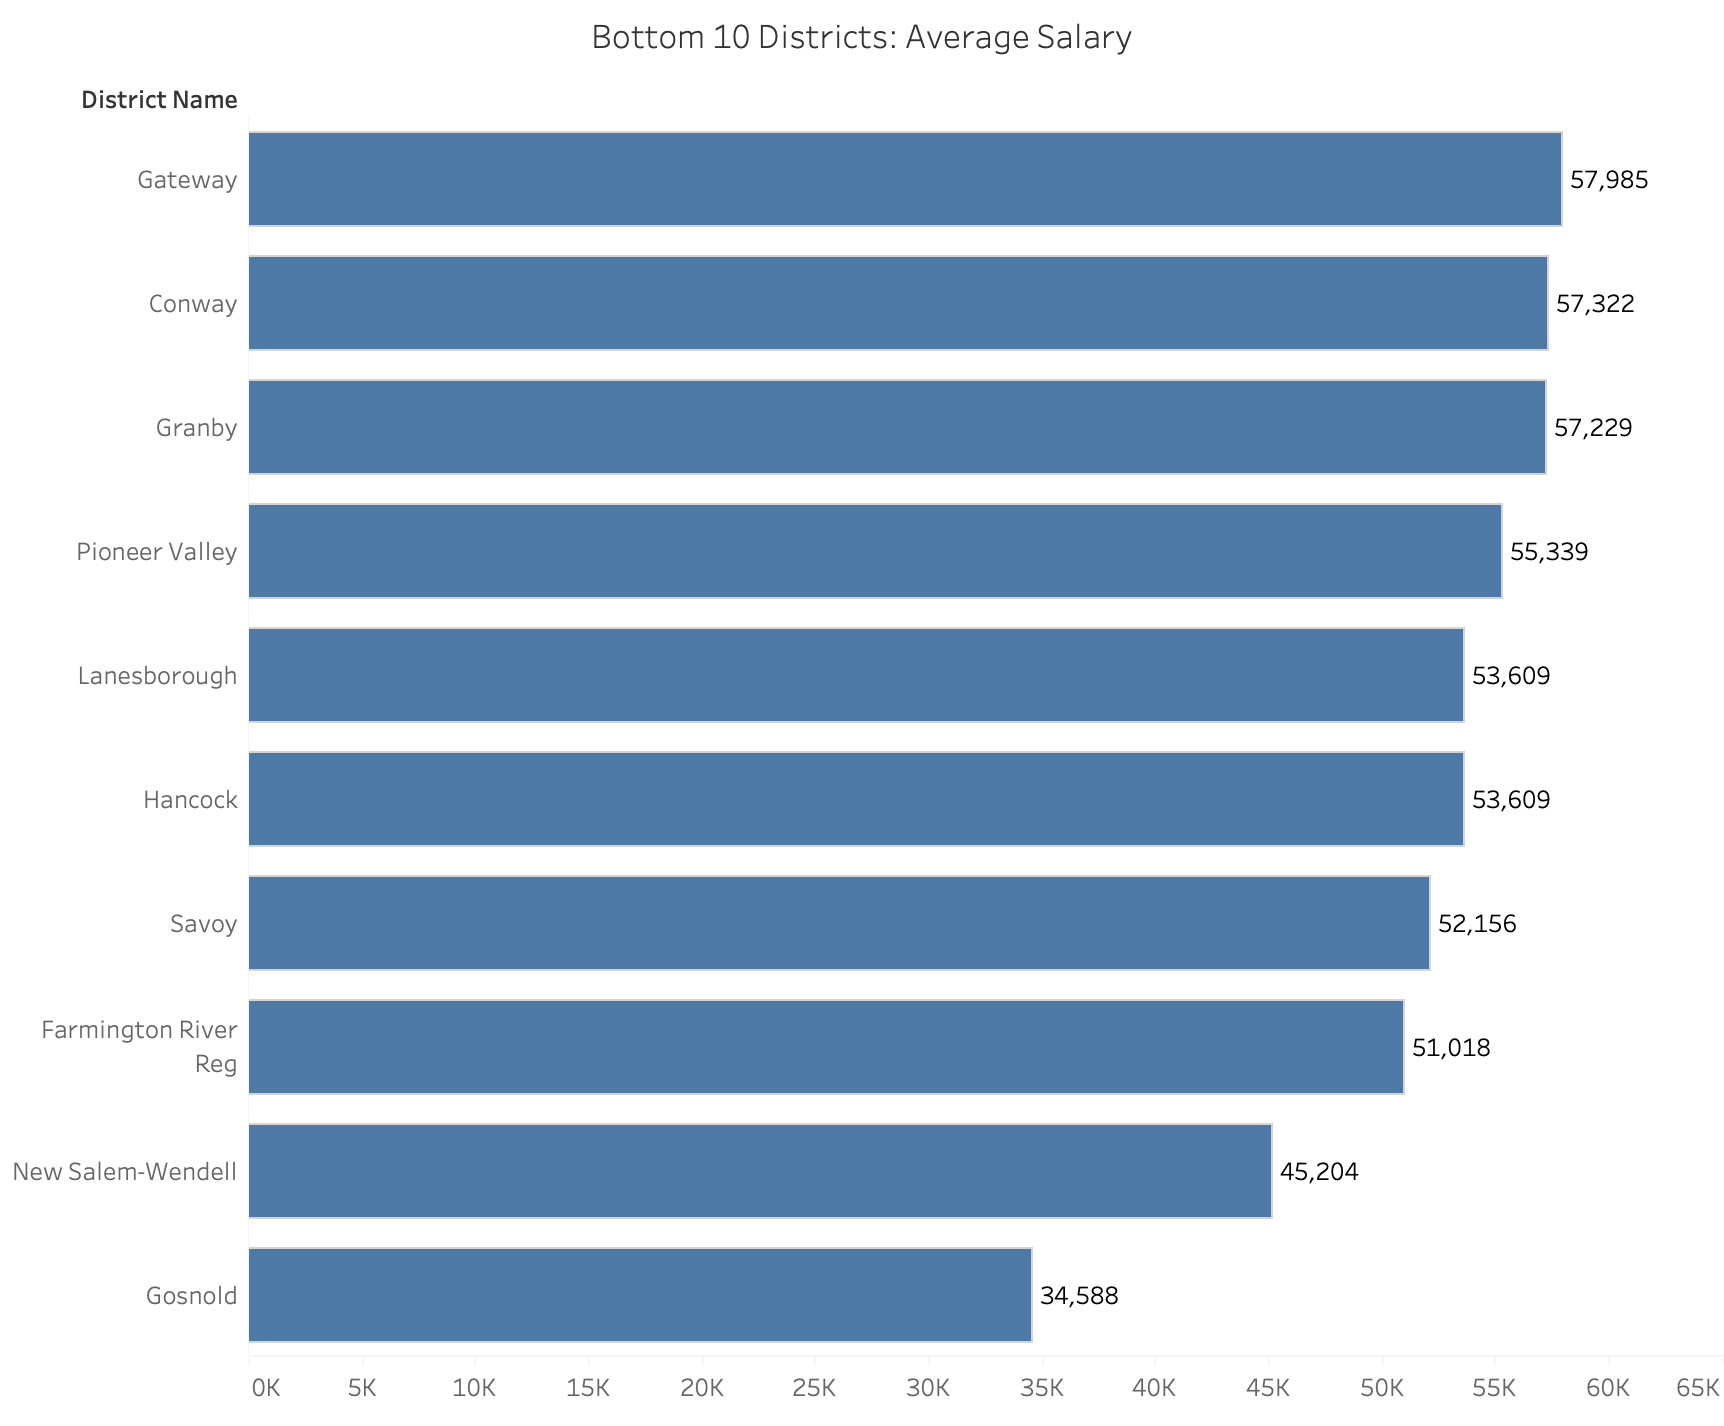
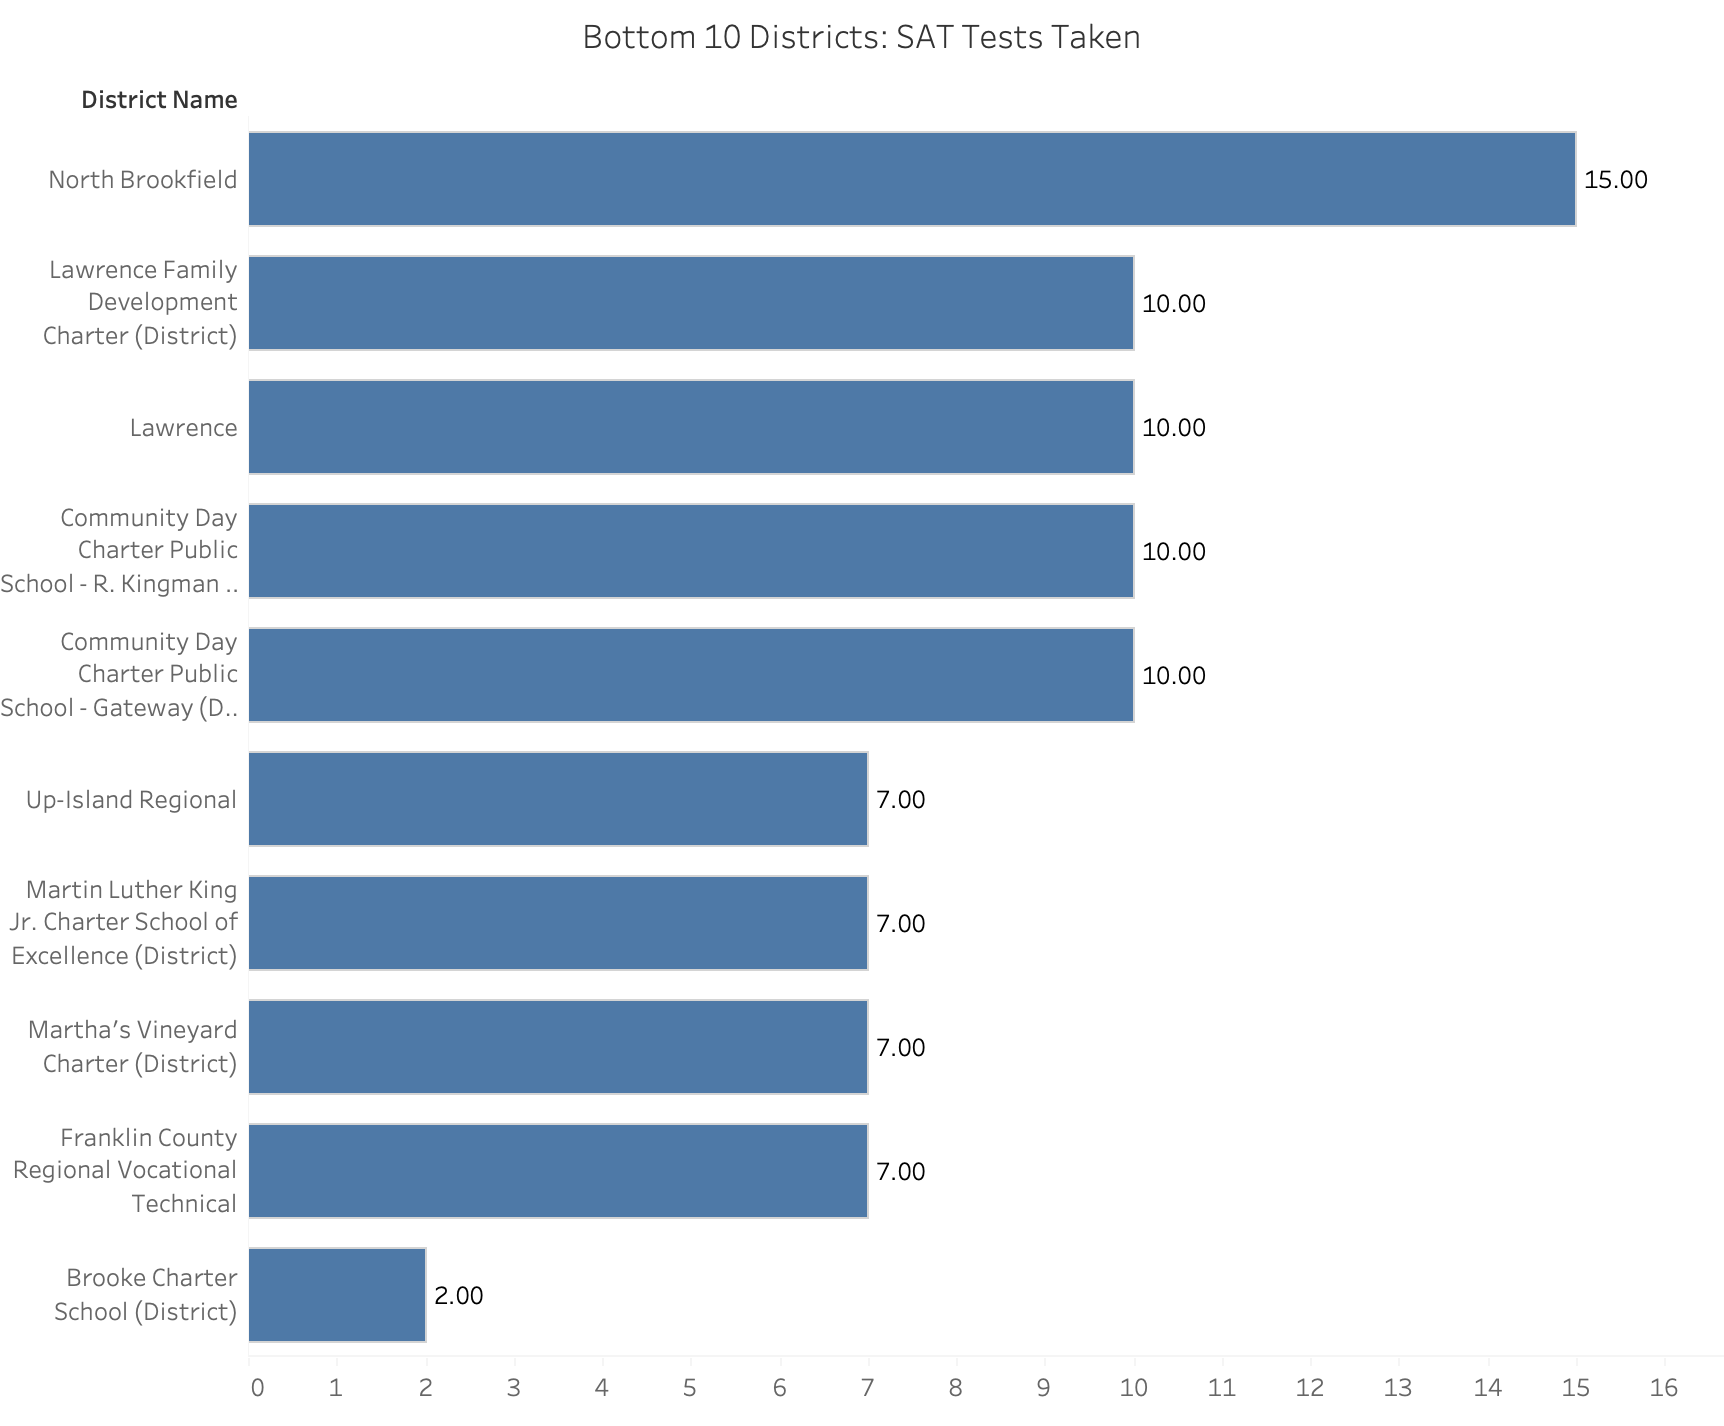
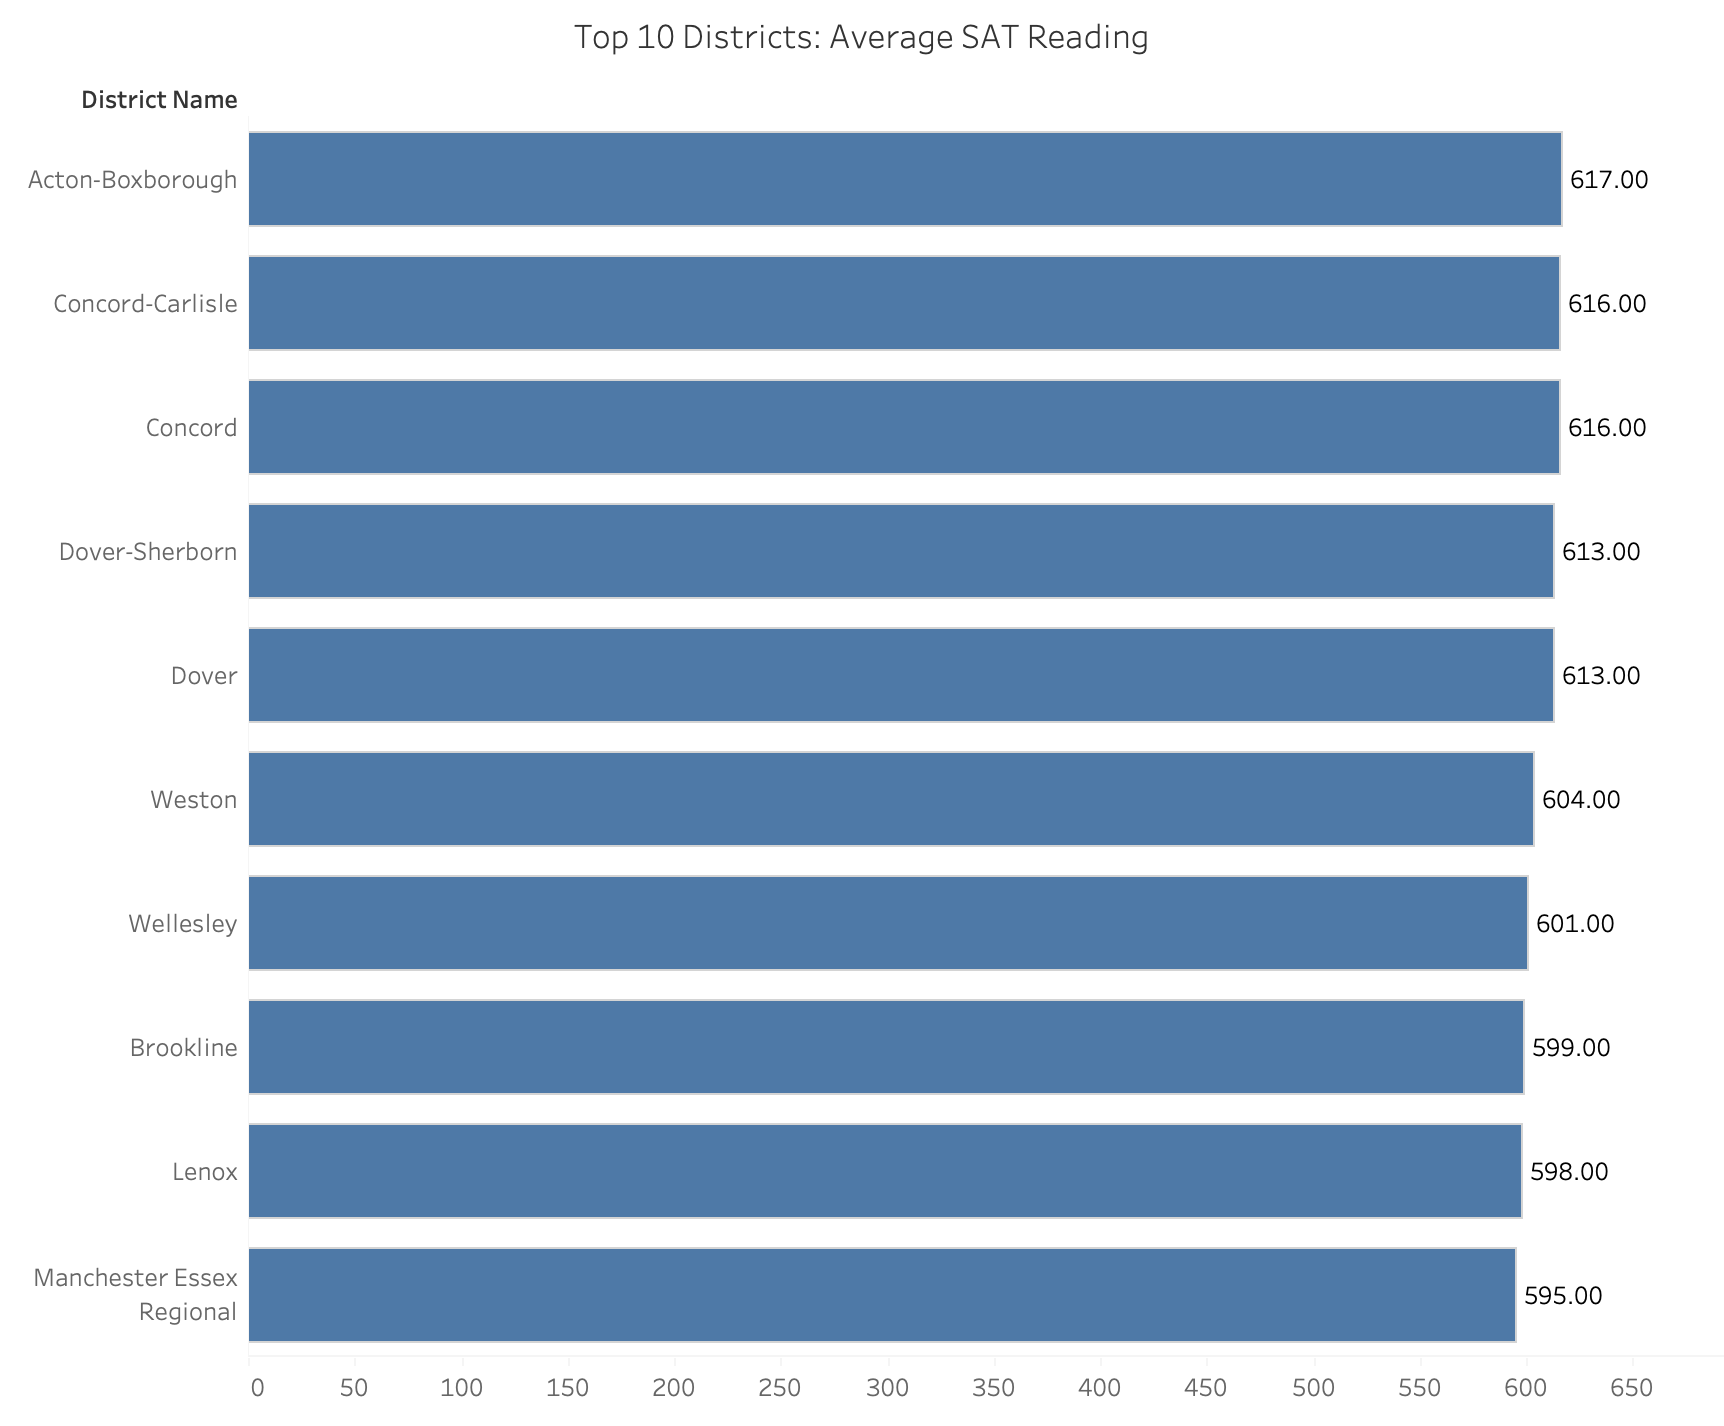
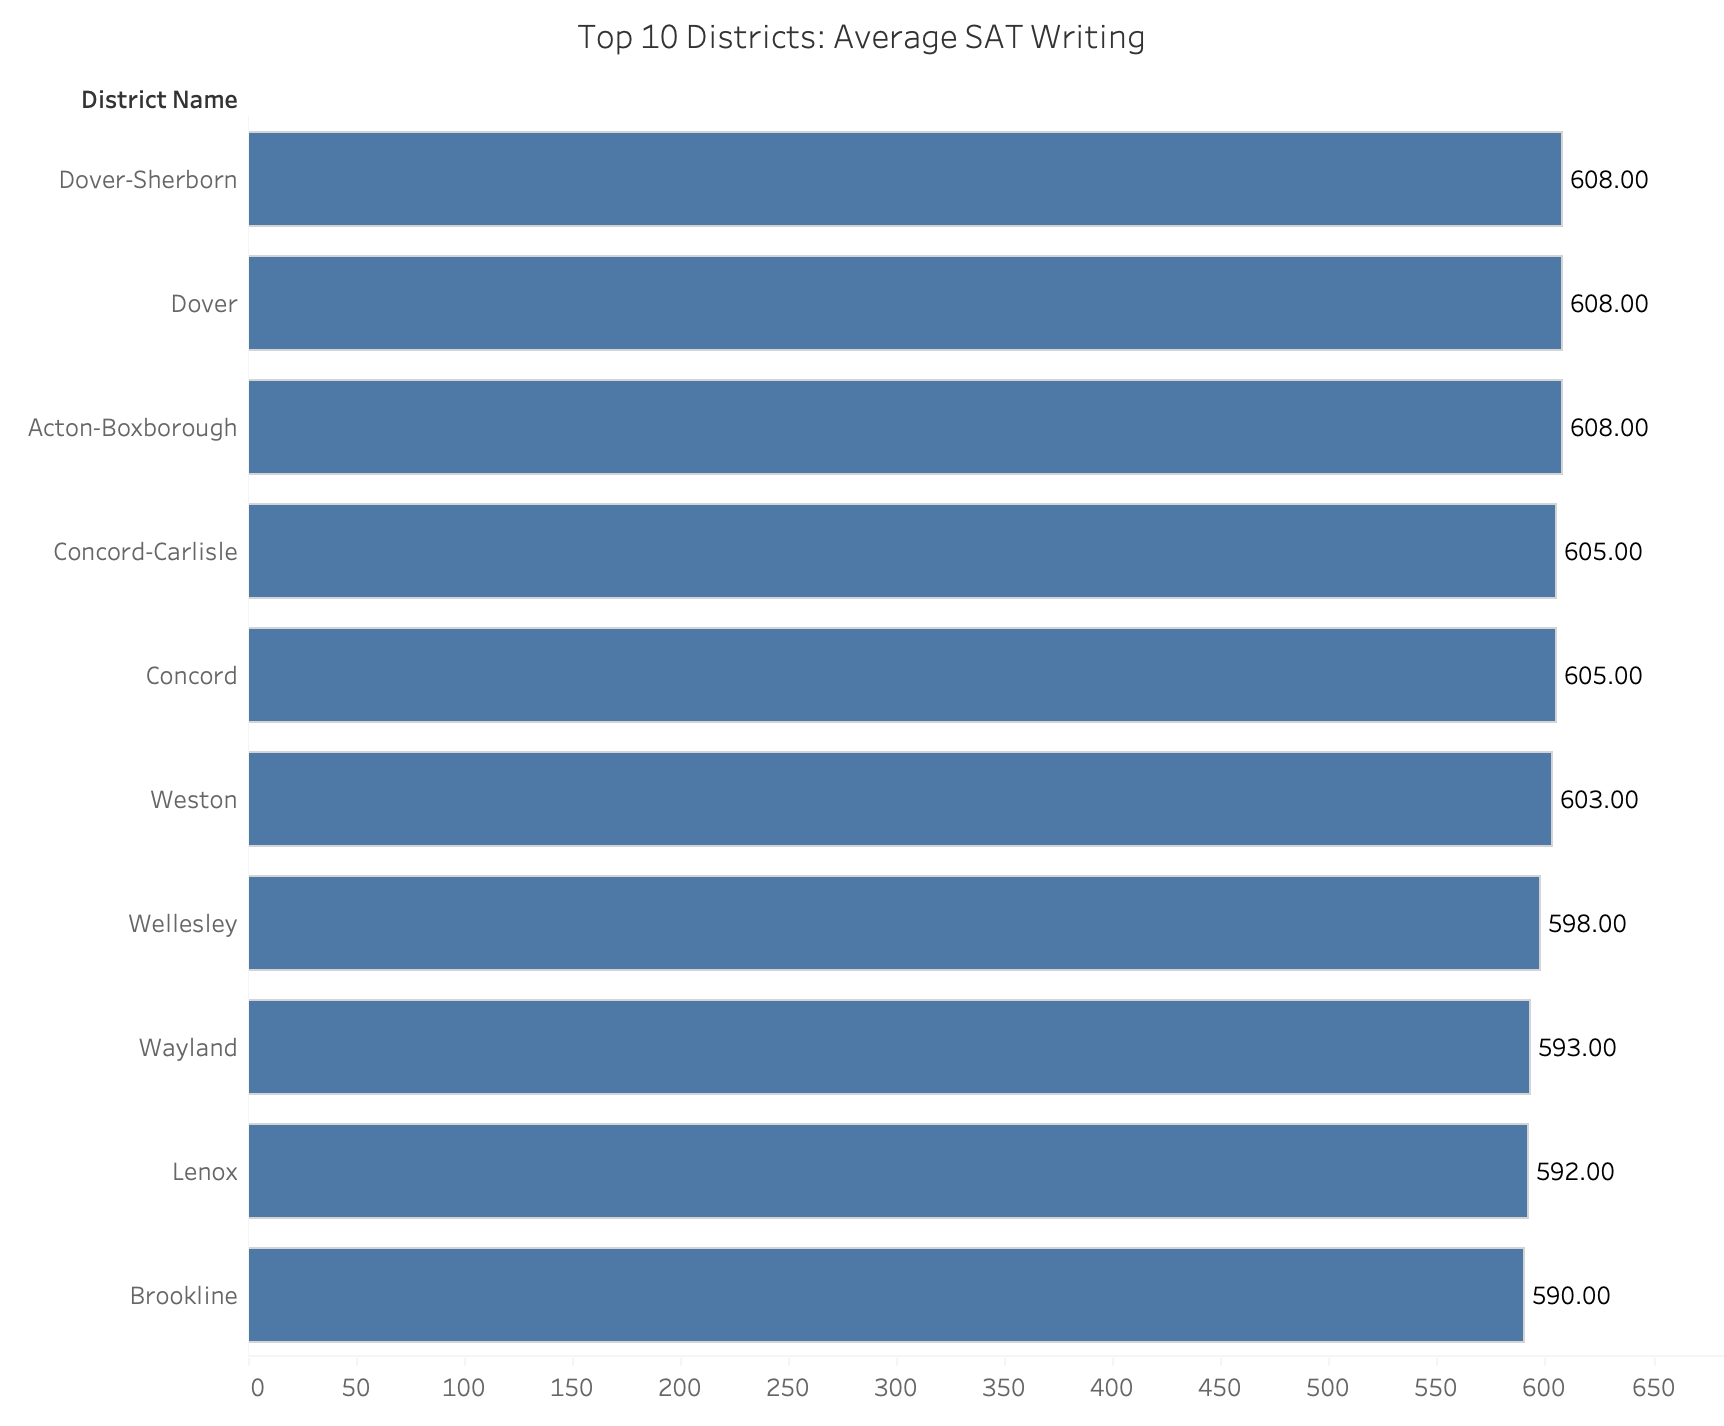
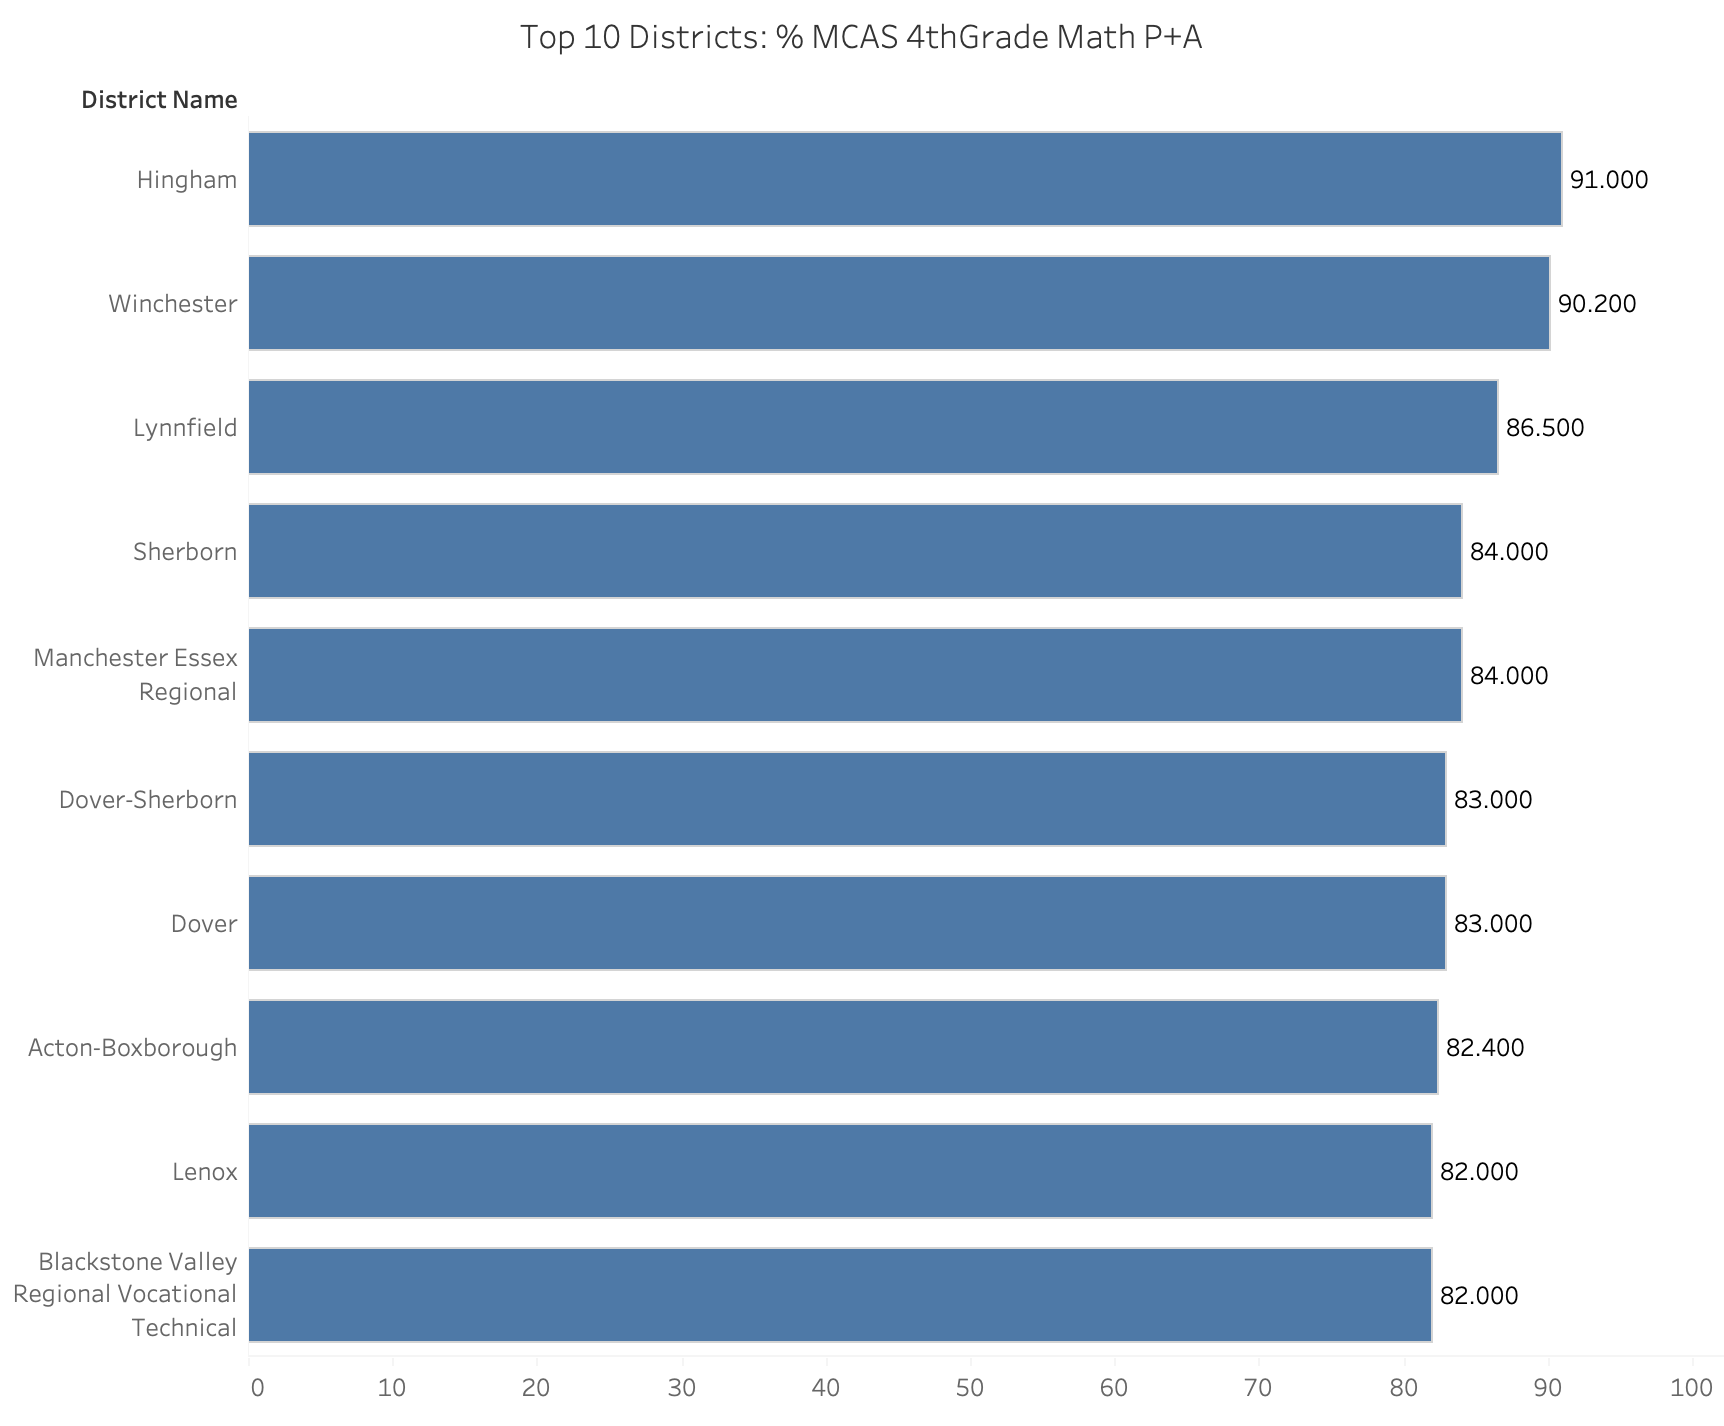
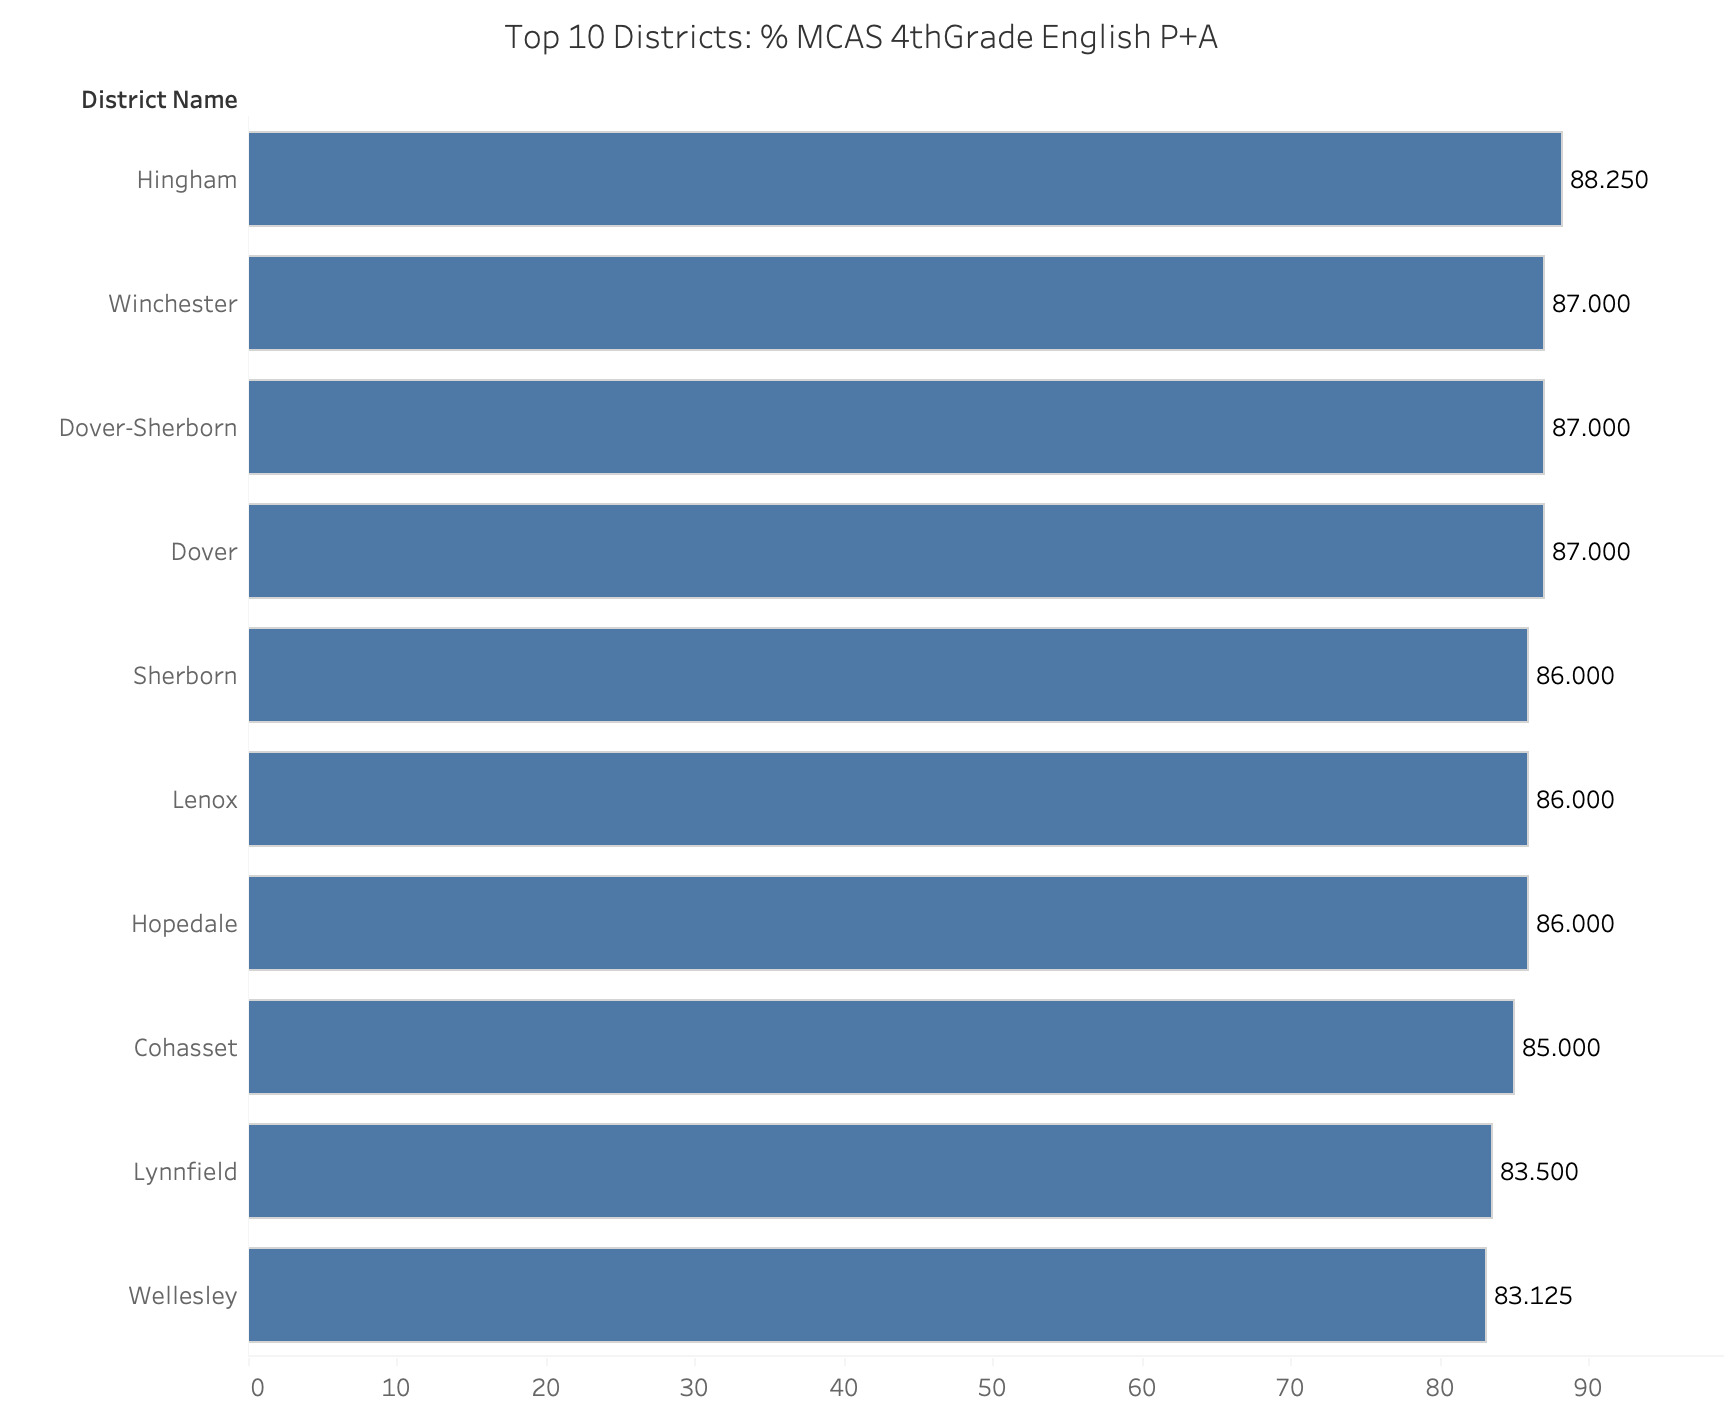
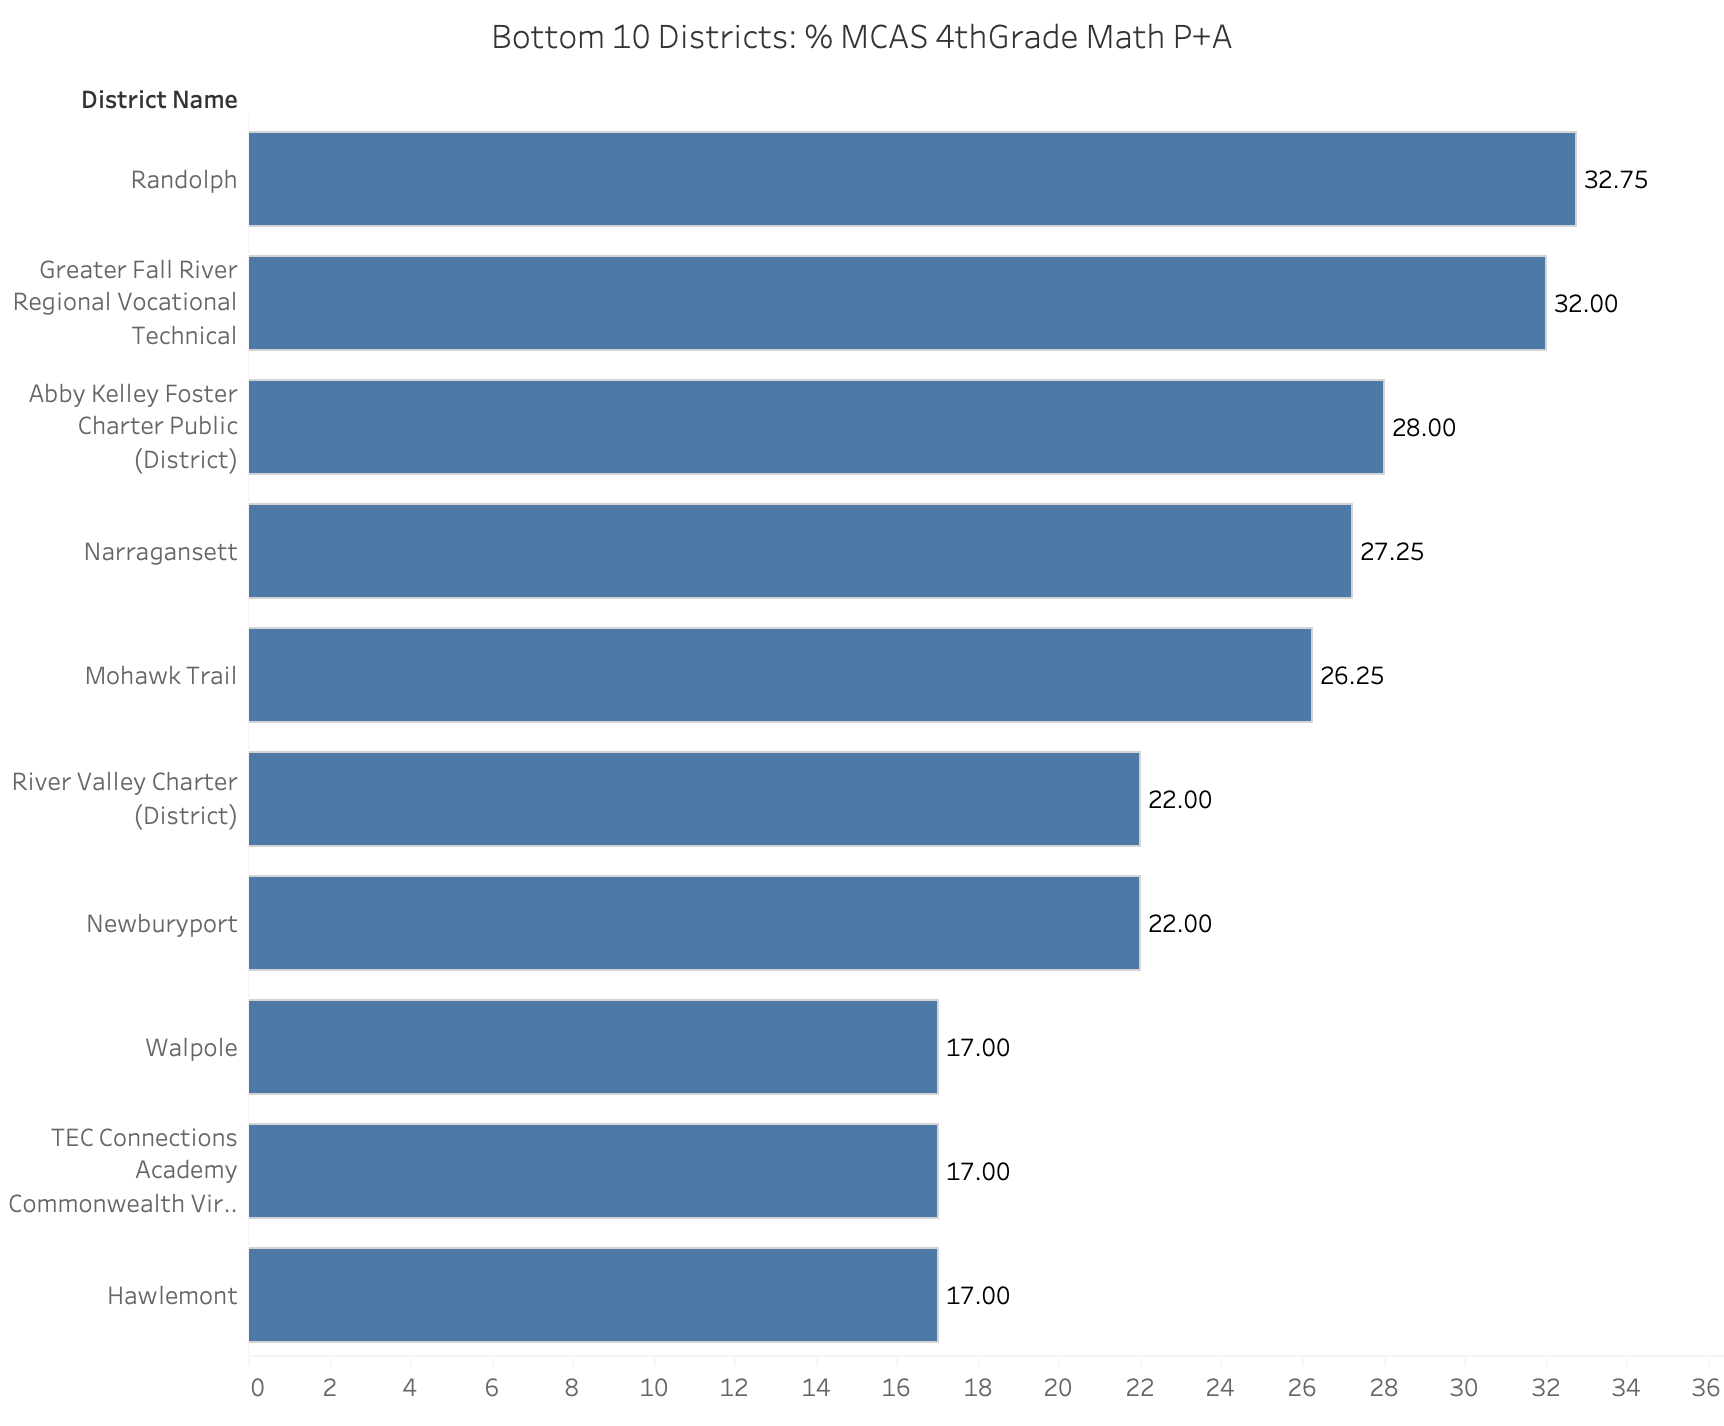
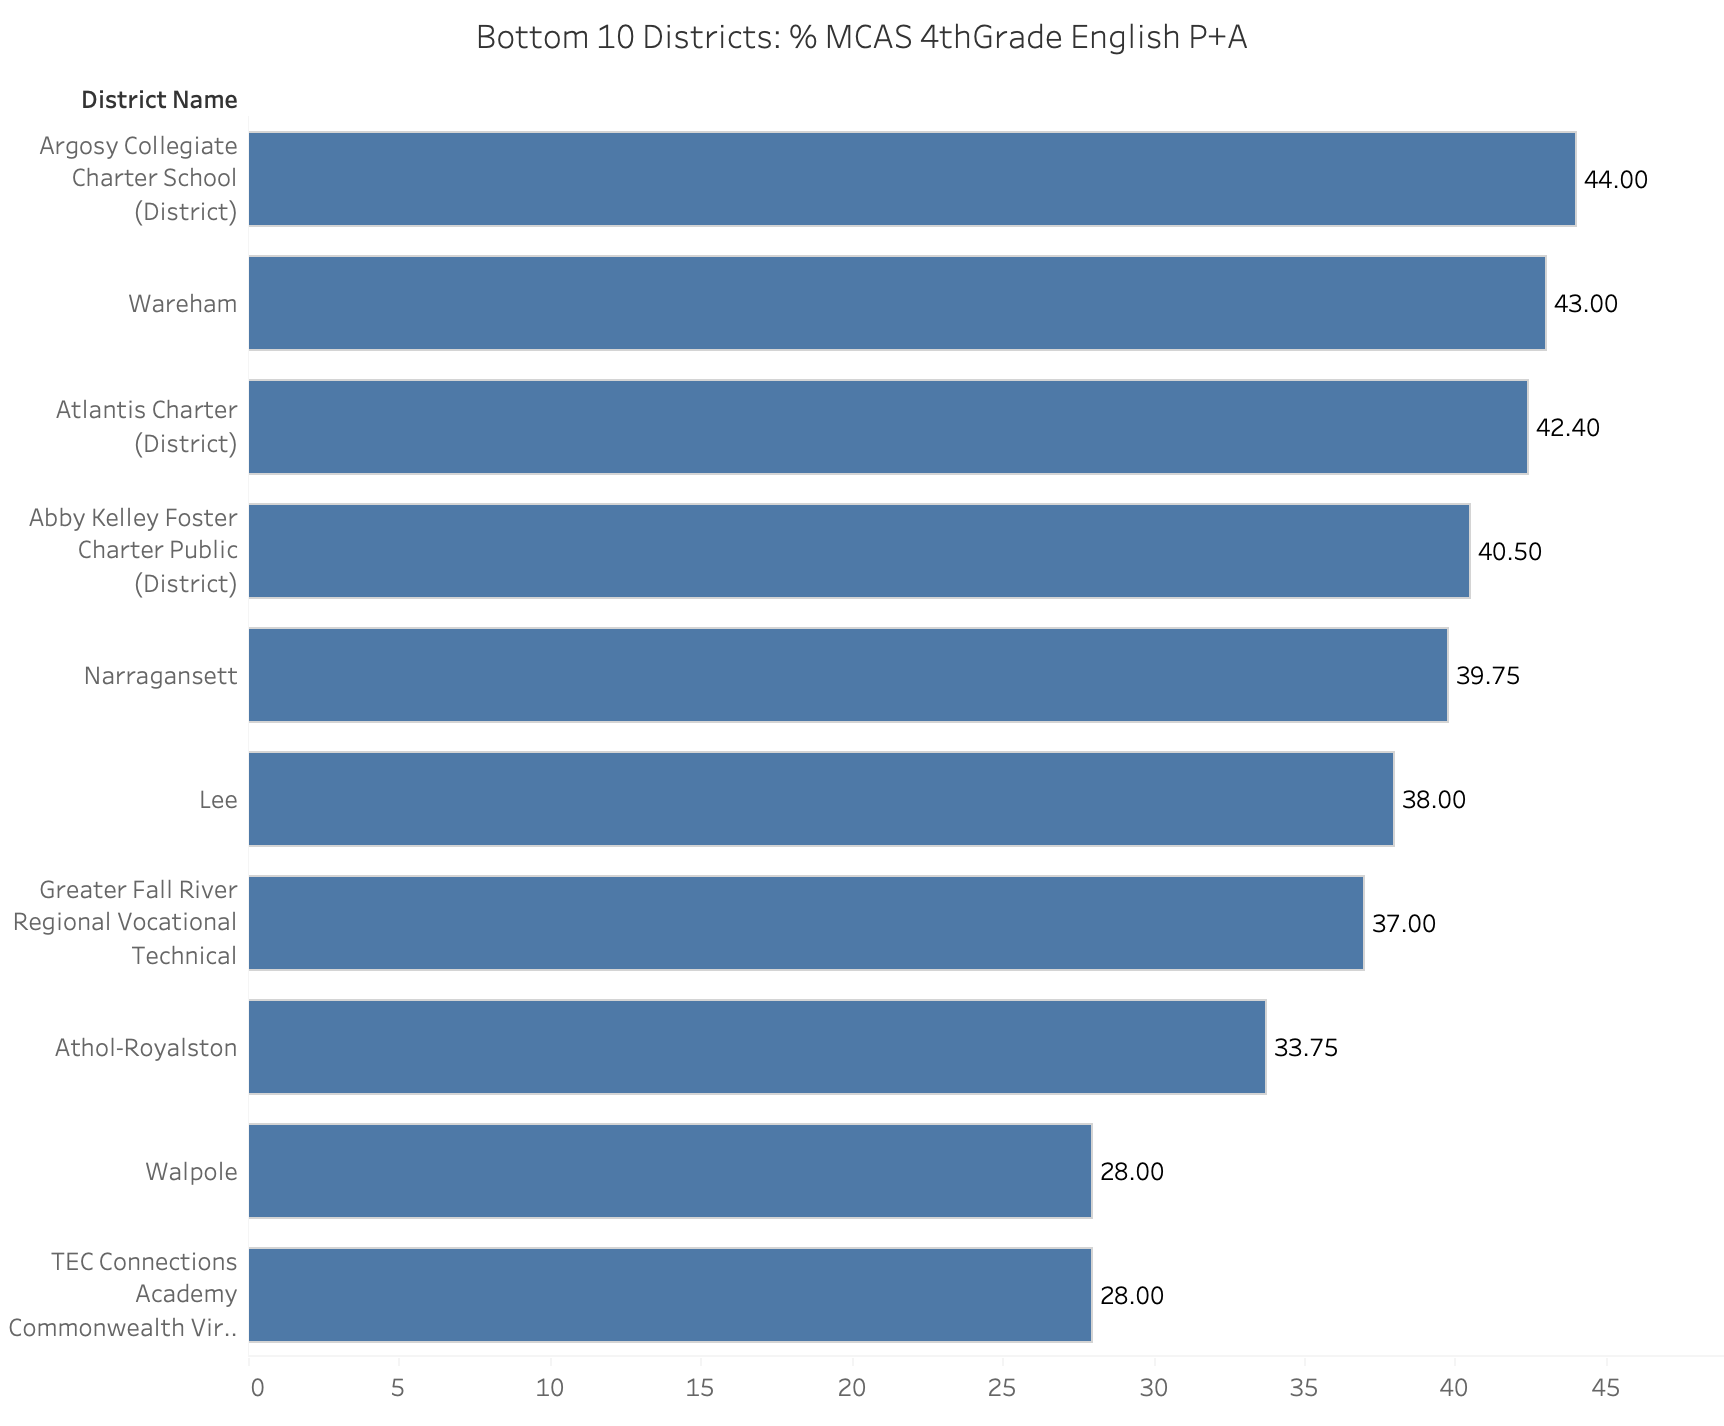
Notable Districts by Metric